trino-taxi-data
This demo will
-
Install the required Stackable operators.
-
Spin up the following data products:
-
Superset: A modern data exploration and visualization platform. This demo utilizes Superset to retrieve data from Trino via SQL queries and build dashboards on top of that data.
-
Trino: A fast distributed SQL query engine for big data analytics that helps you explore your data universe. This demo uses it to enable SQL access to the data.
-
MinIO: A S3 compatible object store. This demo uses it as persistent storage to store all the data used
-
Hive metastore: A service that stores metadata related to Apache Hive and other services. This demo uses it as metadata storage for Trino.
-
Open policy agent (OPA): An open-source, general-purpose policy engine unifying policy enforcement across the stack. This demo uses it as the authorizer for Trino, which decides which user can query which data.
-
-
Load test data into S3. It contains 2.5 years of New York City taxi trips.
-
Make data accessible via SQL in Trino.
-
Create Superset dashboards for visualization of the data.
You can see the deployed products and their relationship in the following diagram:

System Requirements
To run this demo, your system needs at least:
-
7 cpu units (core/hyperthread)
-
16GiB memory
-
28GiB disk storage
List Deployed Stacklets
To list the installed Stackable services, run the following command:
$ stackablectl stacklets list
┌─────────┬──────────────┬───────────┬──────────────────────────────────────────────┐
│ PRODUCT ┆ NAME         ┆ NAMESPACE ┆ ENDPOINTS                                    │
╞═════════╪══════════════╪═══════════╪══════════════════════════════════════════════╡
│ hive    ┆ hive-iceberg ┆ default   ┆ hive                172.18.0.4:30637         │
│         ┆              ┆           ┆ metrics             172.18.0.4:30176         │
├╌╌╌╌╌╌╌╌╌┼╌╌╌╌╌╌╌╌╌╌╌╌╌╌┼╌╌╌╌╌╌╌╌╌╌╌┼╌╌╌╌╌╌╌╌╌╌╌╌╌╌╌╌╌╌╌╌╌╌╌╌╌╌╌╌╌╌╌╌╌╌╌╌╌╌╌╌╌╌╌╌╌╌┤
│ opa     ┆ opa          ┆ default   ┆ http                http://172.18.0.2:32470  │
├╌╌╌╌╌╌╌╌╌┼╌╌╌╌╌╌╌╌╌╌╌╌╌╌┼╌╌╌╌╌╌╌╌╌╌╌┼╌╌╌╌╌╌╌╌╌╌╌╌╌╌╌╌╌╌╌╌╌╌╌╌╌╌╌╌╌╌╌╌╌╌╌╌╌╌╌╌╌╌╌╌╌╌┤
│ trino   ┆ trino        ┆ default   ┆ coordinator-metrics 172.18.0.2:32402         │
│         ┆              ┆           ┆ coordinator-https   https://172.18.0.2:31605 │
├╌╌╌╌╌╌╌╌╌┼╌╌╌╌╌╌╌╌╌╌╌╌╌╌┼╌╌╌╌╌╌╌╌╌╌╌┼╌╌╌╌╌╌╌╌╌╌╌╌╌╌╌╌╌╌╌╌╌╌╌╌╌╌╌╌╌╌╌╌╌╌╌╌╌╌╌╌╌╌╌╌╌╌┤
│ minio   ┆ minio        ┆ default   ┆ http                http://172.18.0.2:30357  │
│         ┆              ┆           ┆ console-http        http://172.18.0.2:30310  │
└─────────┴──────────────┴───────────┴──────────────────────────────────────────────┘|
When a product instance has not finished starting yet, the service will have no endpoint. Depending on your internet connectivity, creating all the product instances might take considerable time. A warning might be shown if the product is not ready yet. |
Inspect Data in S3
The S3 provided by MinIO is used as a persistent storage to store all the data used. You can look at the test data
within the MinIO web interface by opening the endpoint console-http from your stackablectl stacklets list command
output. You have to use the endpoint from your command output. In this case, it is http://172.18.0.3:30503. Open it with
your favourite browser.
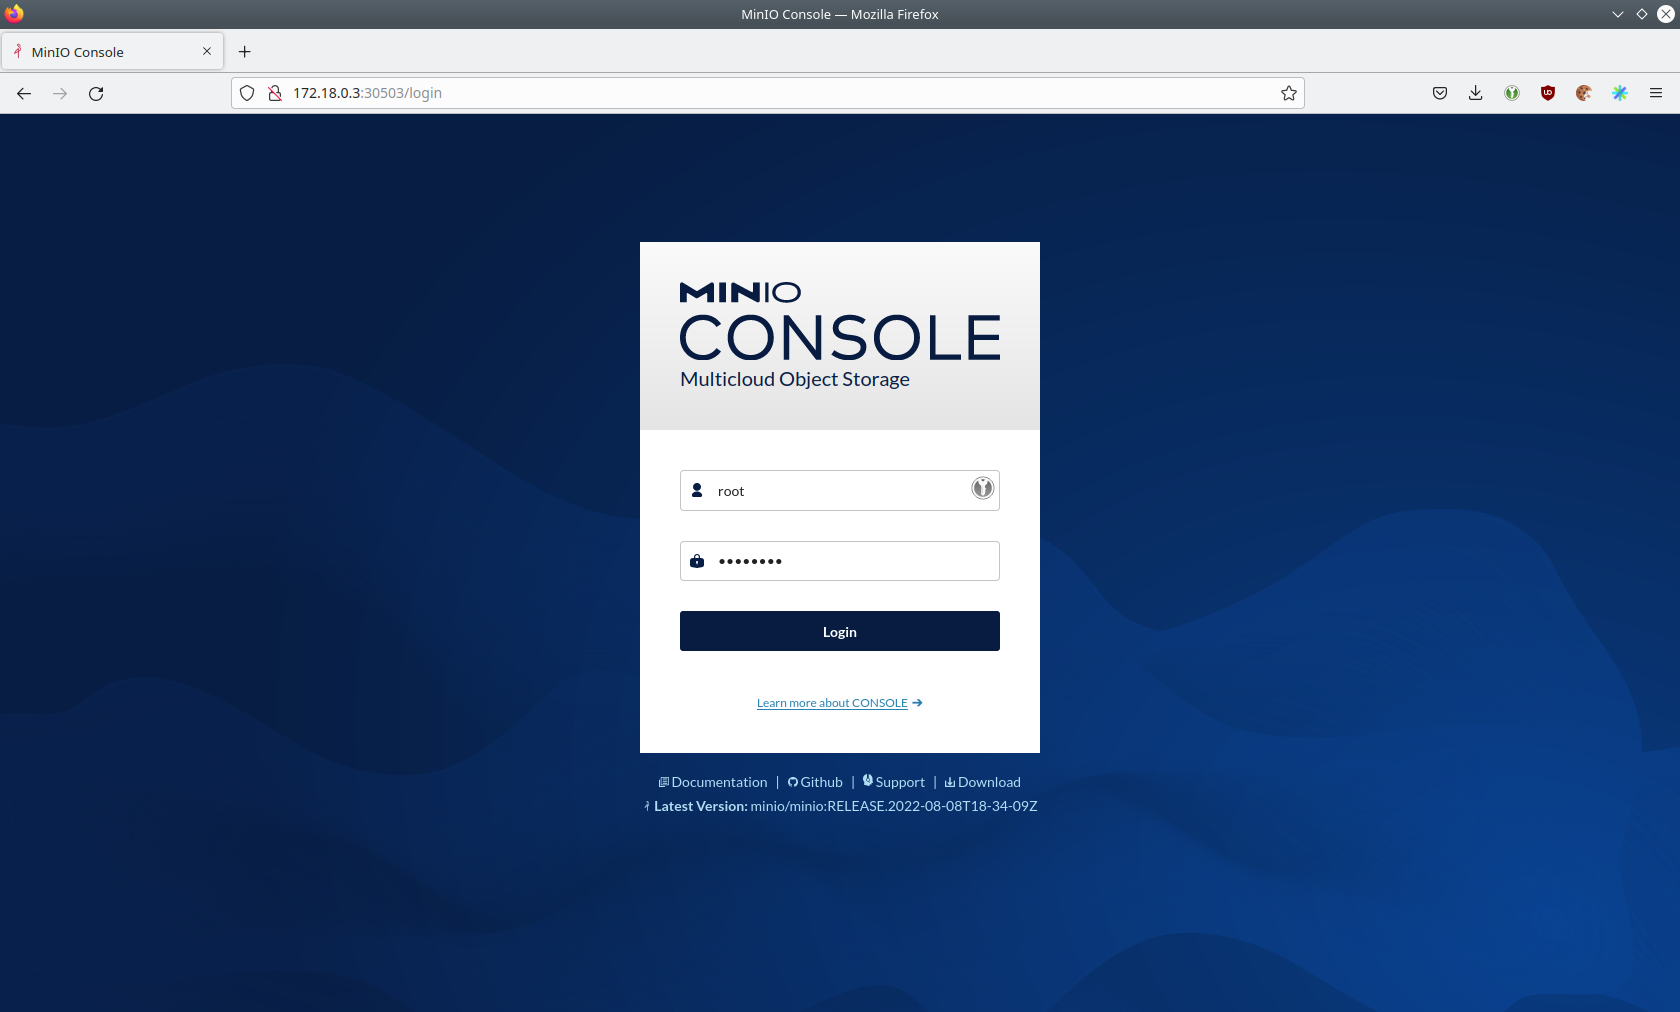
Log in with the username admin and password adminadmin.
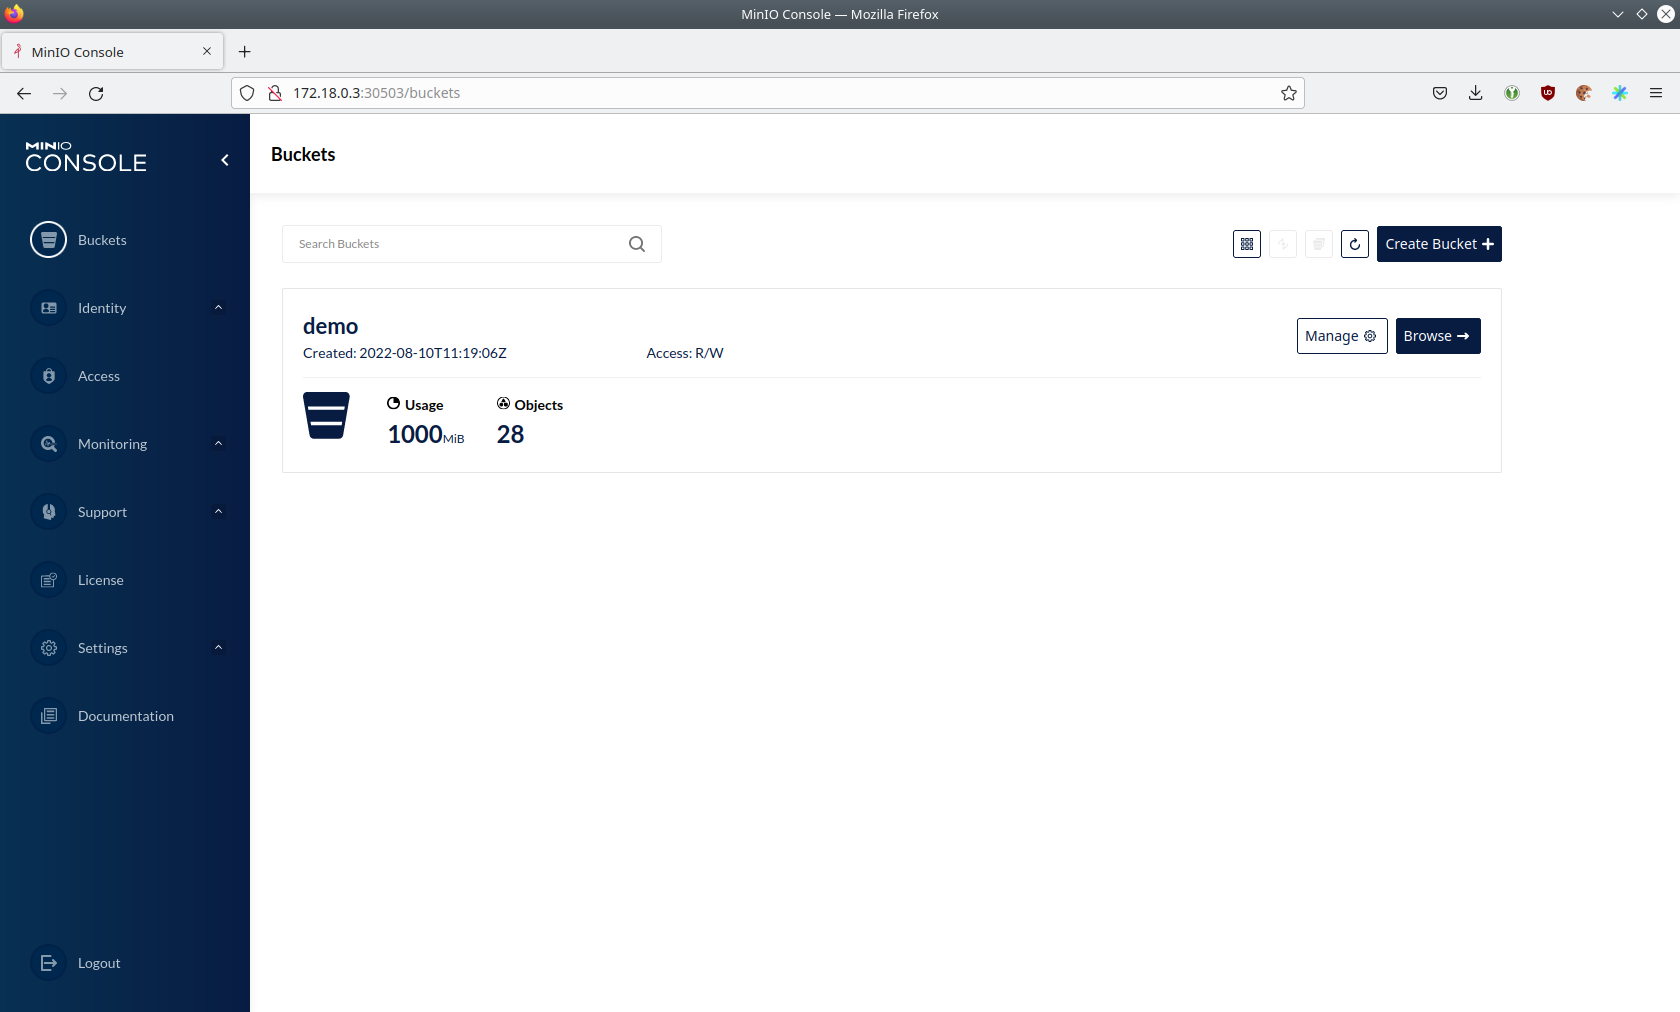
Click on the blue button Browse on the bucket demo and open the folders ny-taxi-data → raw.
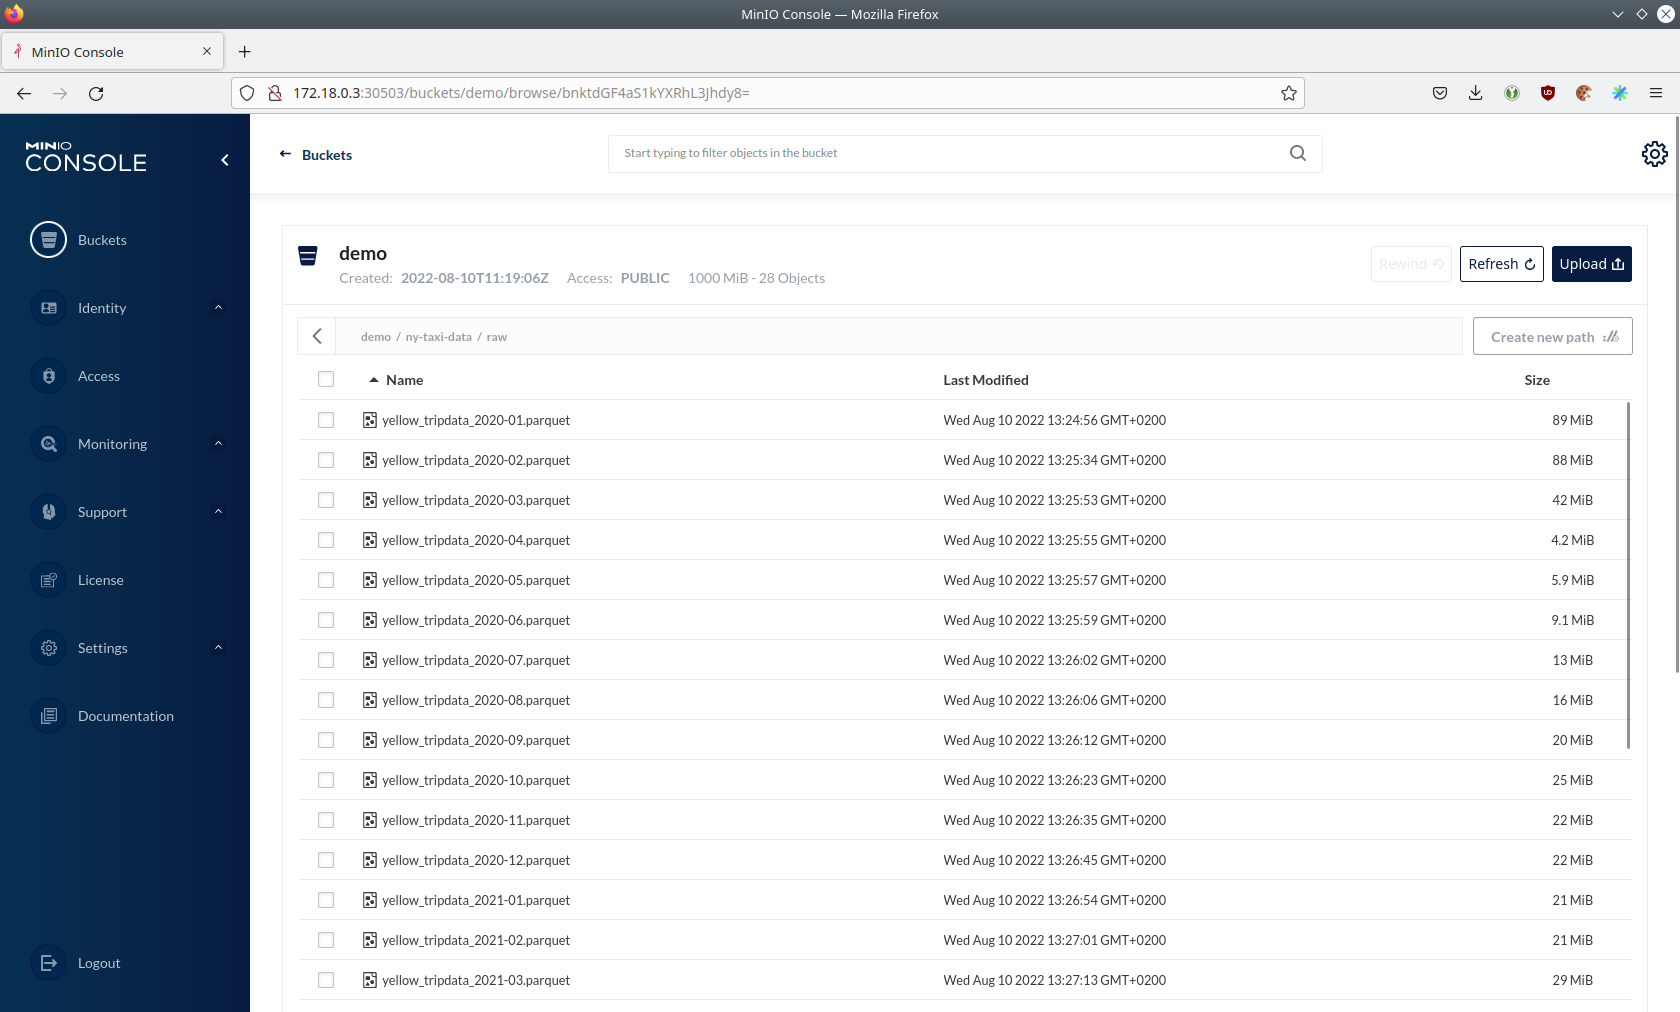
The demo uploaded 1GB of parquet files, one file per month. The data contains taxi rides in New York City. The file size
(and therefore the number of rides) decreased drastically because of the COVID-19 pandemic starting from 2020-03.
Parquet is an open-source, column-oriented data file format for efficient storage and retrieval.
Use Trino Web Interface
Trino offers SQL access to the data within S3. Open the endpoint coordinator-https in your browser
(https://172.18.0.3:30141 in this case). If you get a warning regarding the self-signed certificate (e.g.
Warning: Potential Security Risk Ahead), you must tell your browser to trust the website and continue.
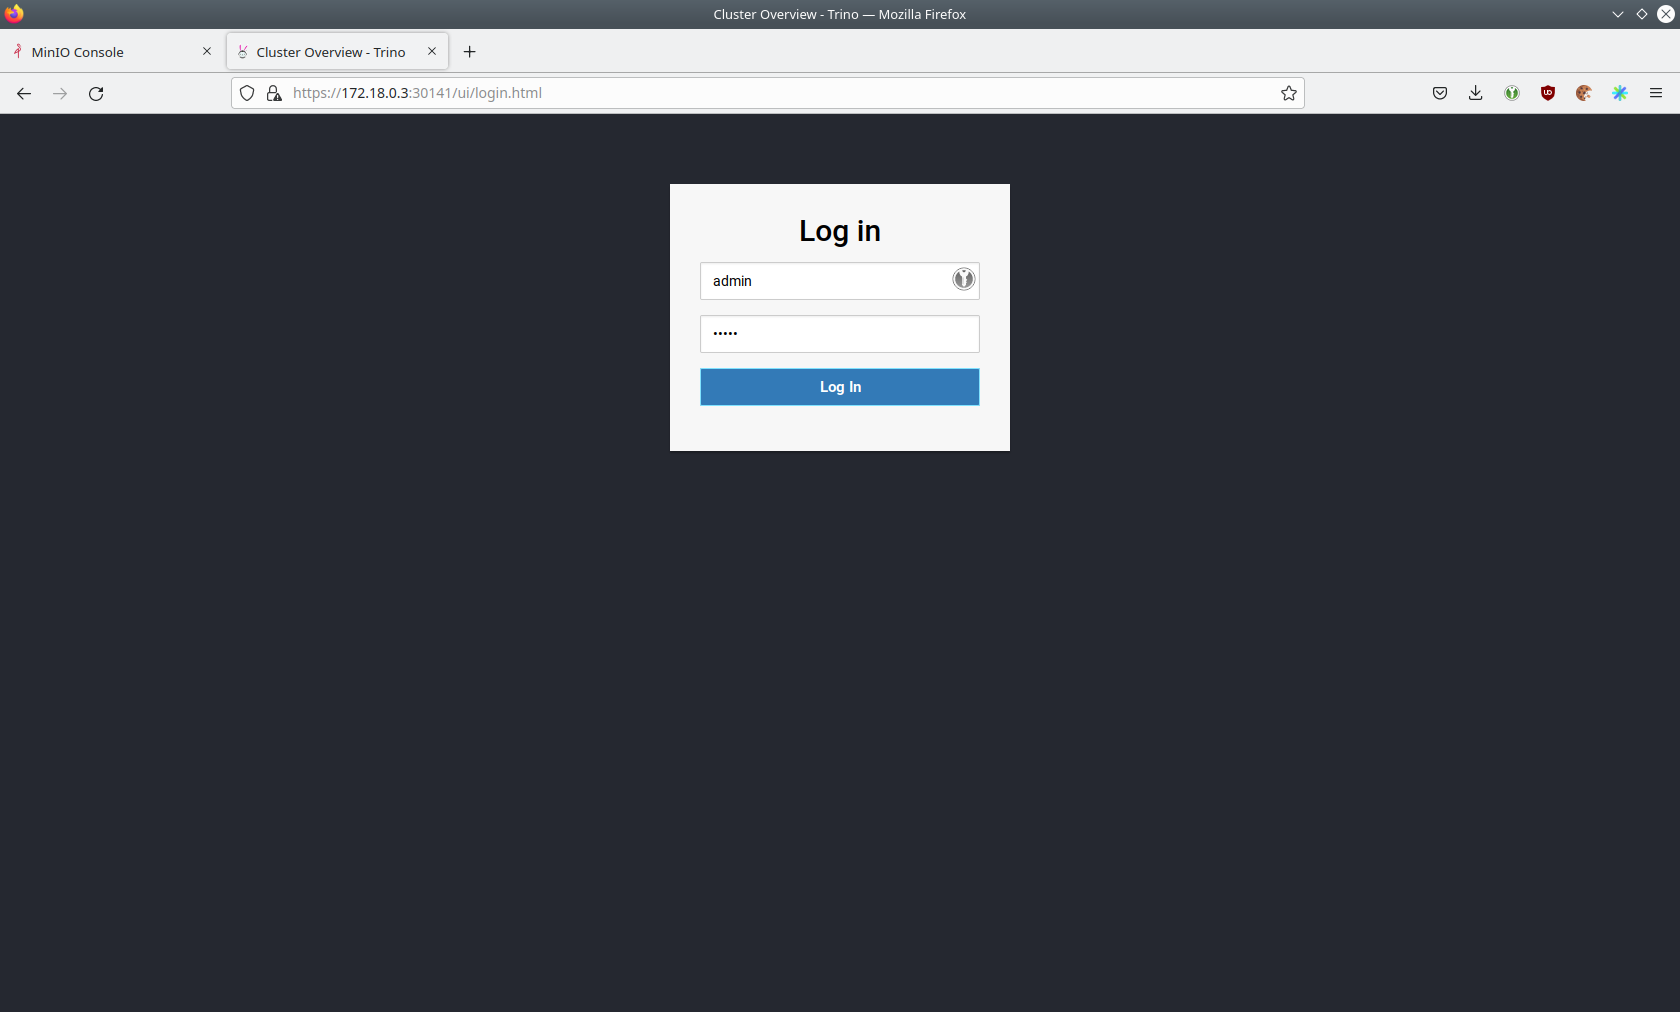
Log in with the username admin and password adminadmin.
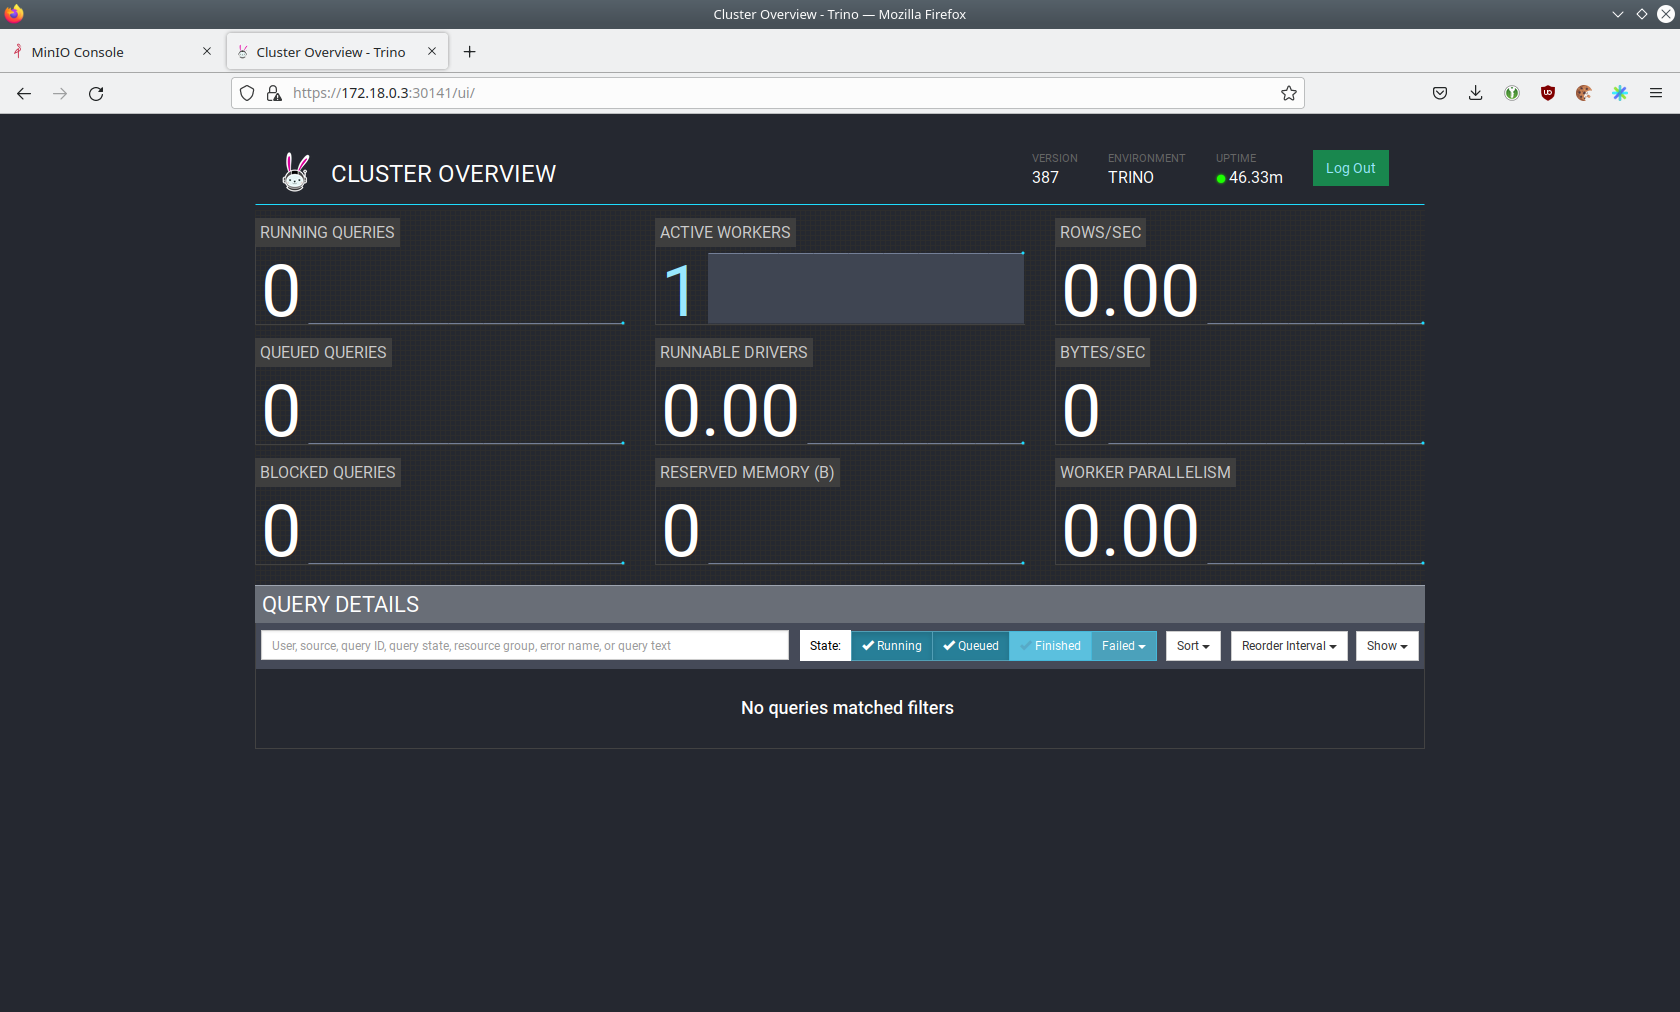
When you start executing SQL queries, you will see the queries getting processed here.
Use Superset Web Interface
Superset gives the ability to execute SQL queries and build dashboards. Open the endpoint external-superset
in your browser (http://172.18.0.4:32295 in this case).
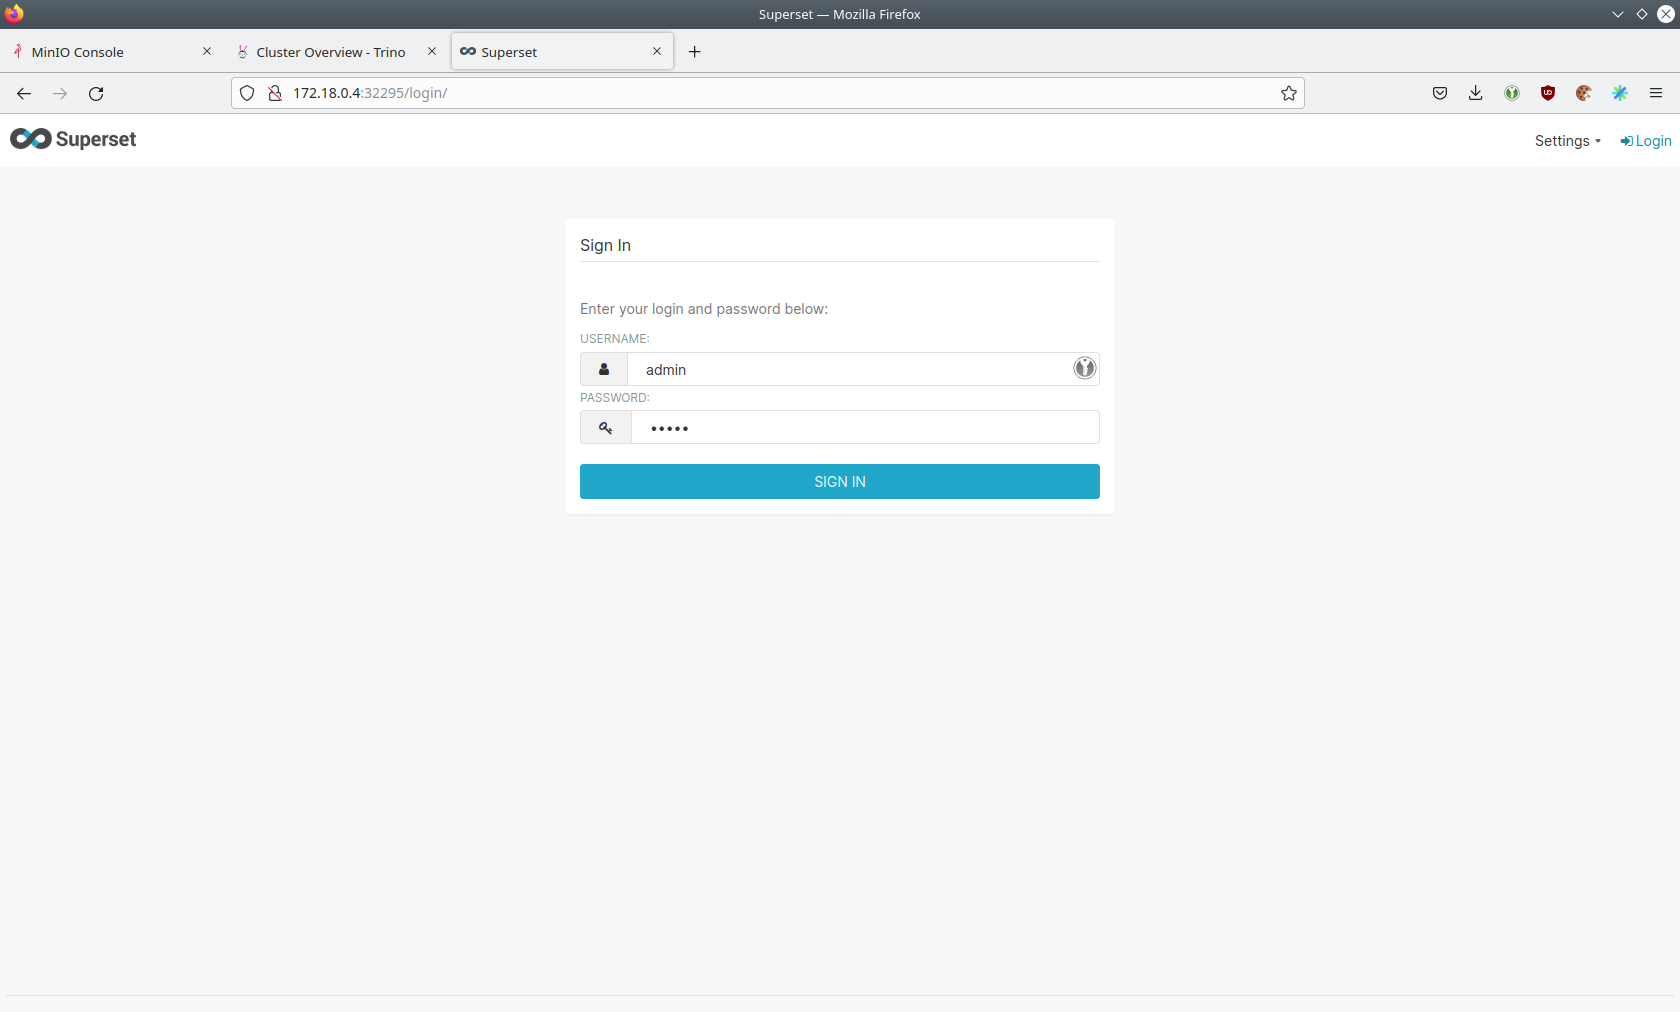
Log in with the username admin and password adminadmin.
View the Dashboard
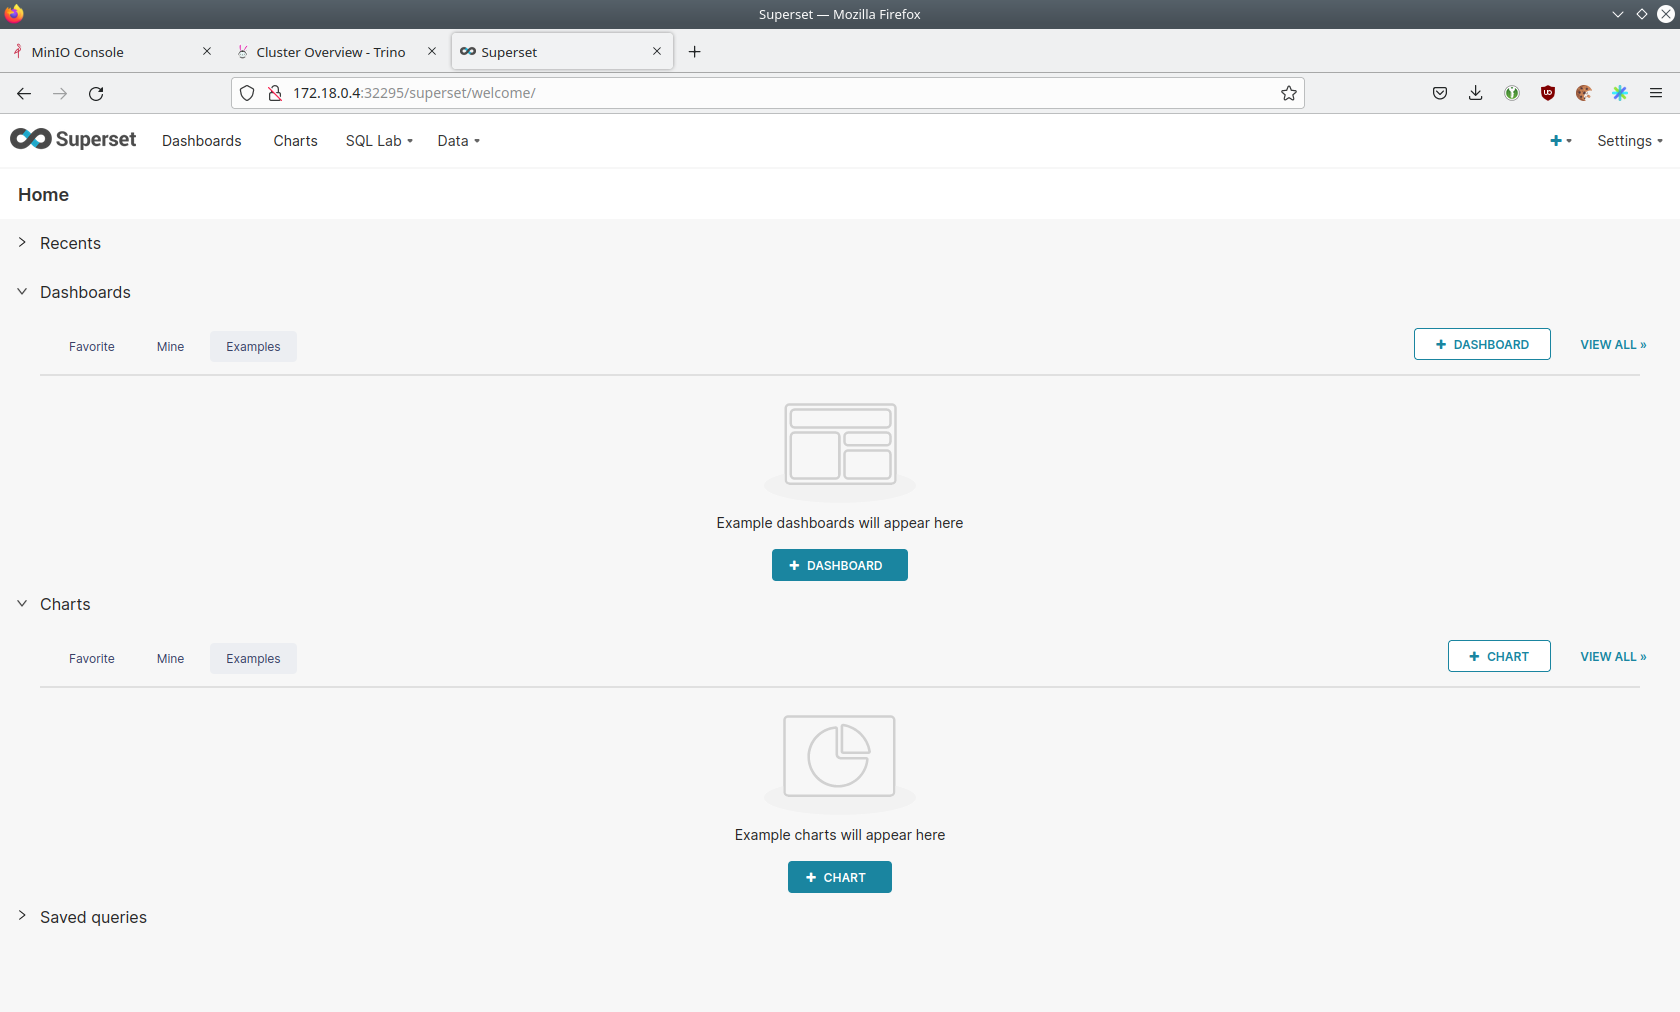
On the top, click on the Dashboards tab.
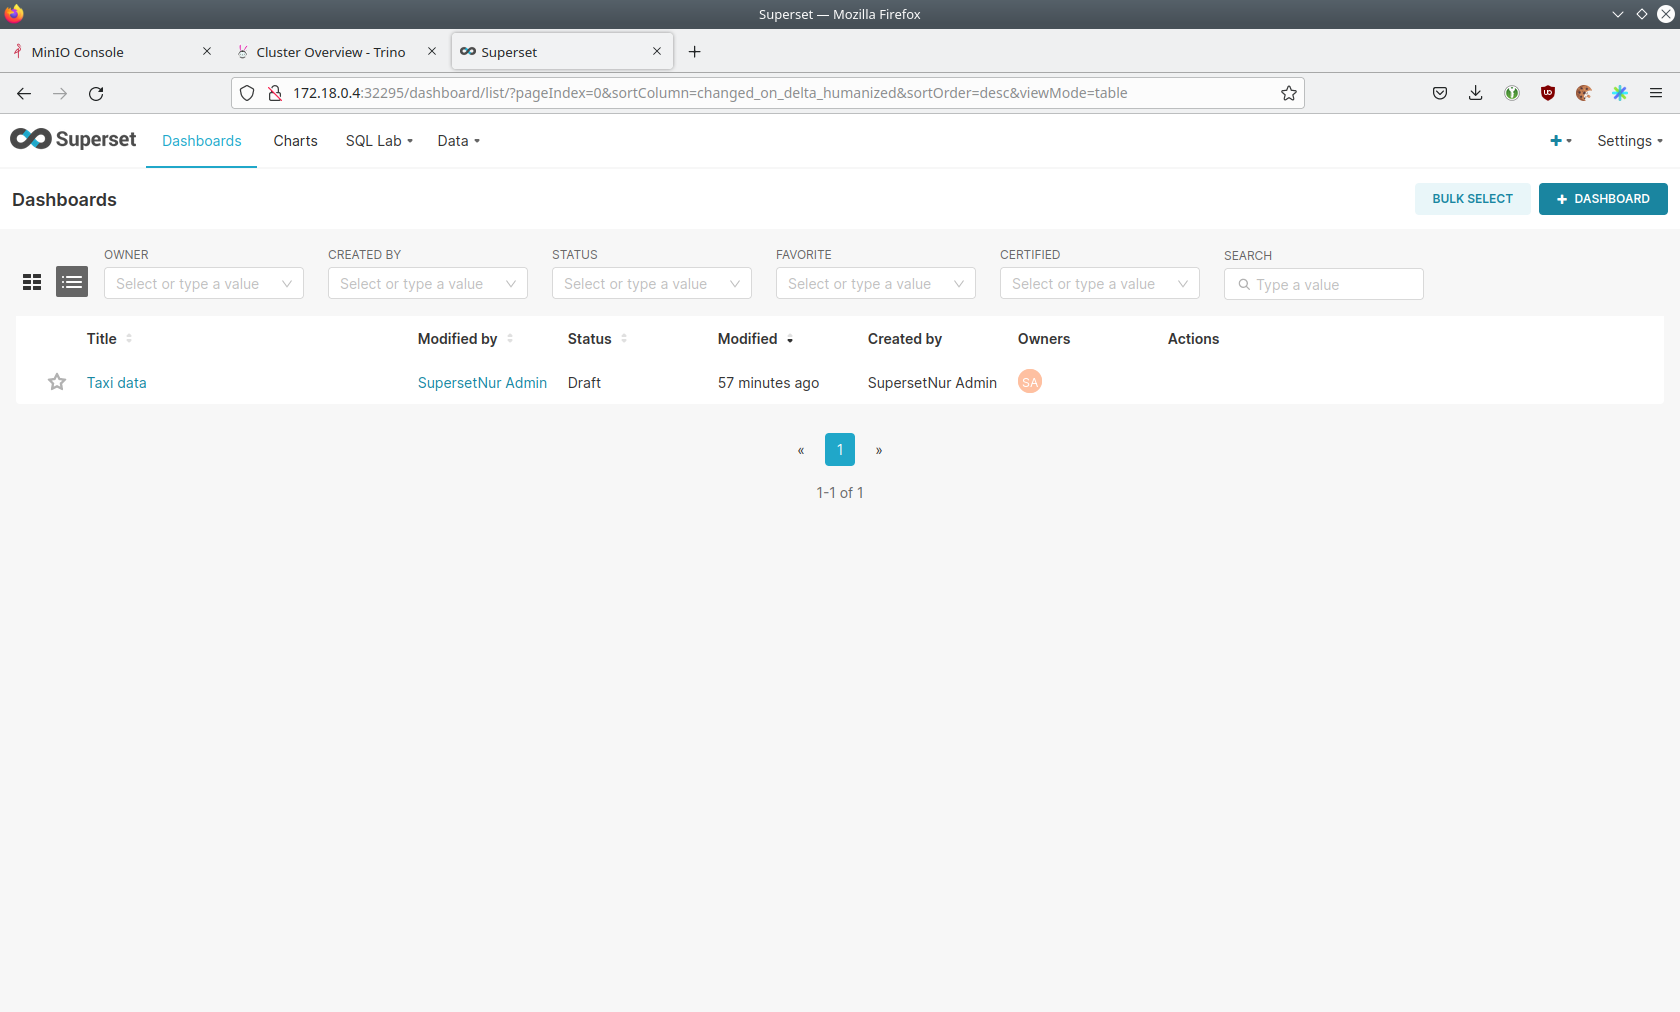
Click on the dashboard called Taxi data. It might take some time until the dashboards render all included charts.
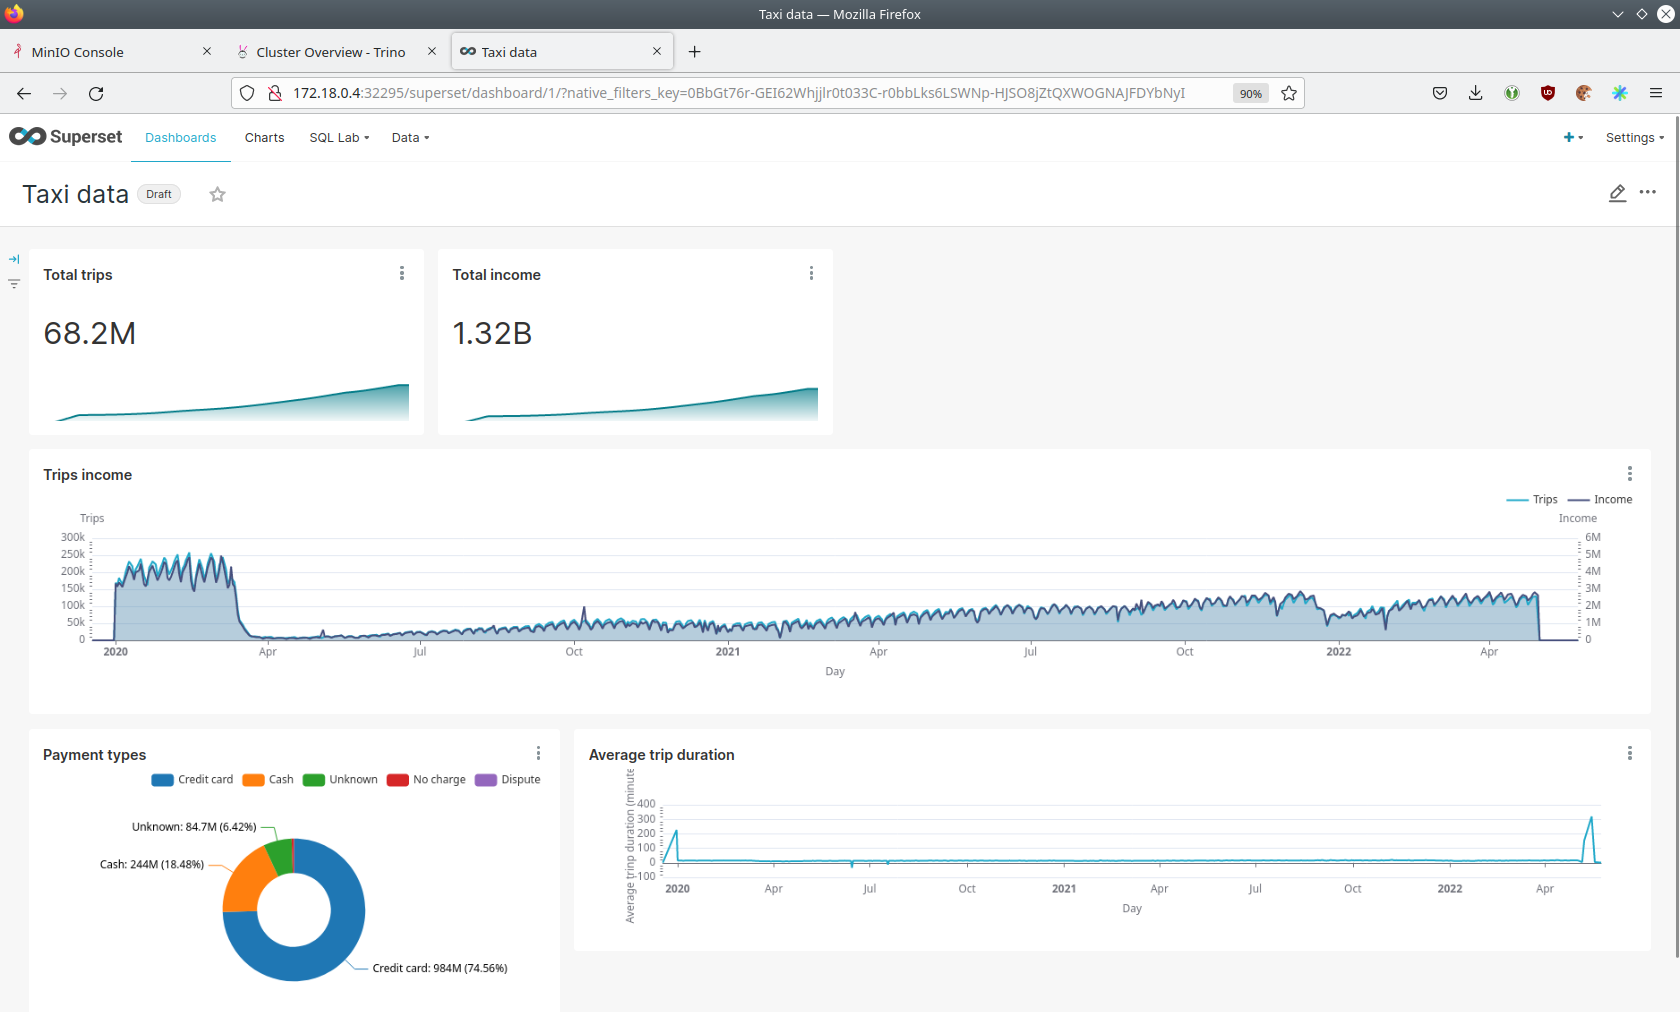
You can clearly see the impact of COVID-19 on the taxi business.
Execute Arbitrary SQL Statements
Within Superset, you can create dashboards and run arbitrary SQL statements. On the top, click on the tab SQL Lab →
SQL Editor.
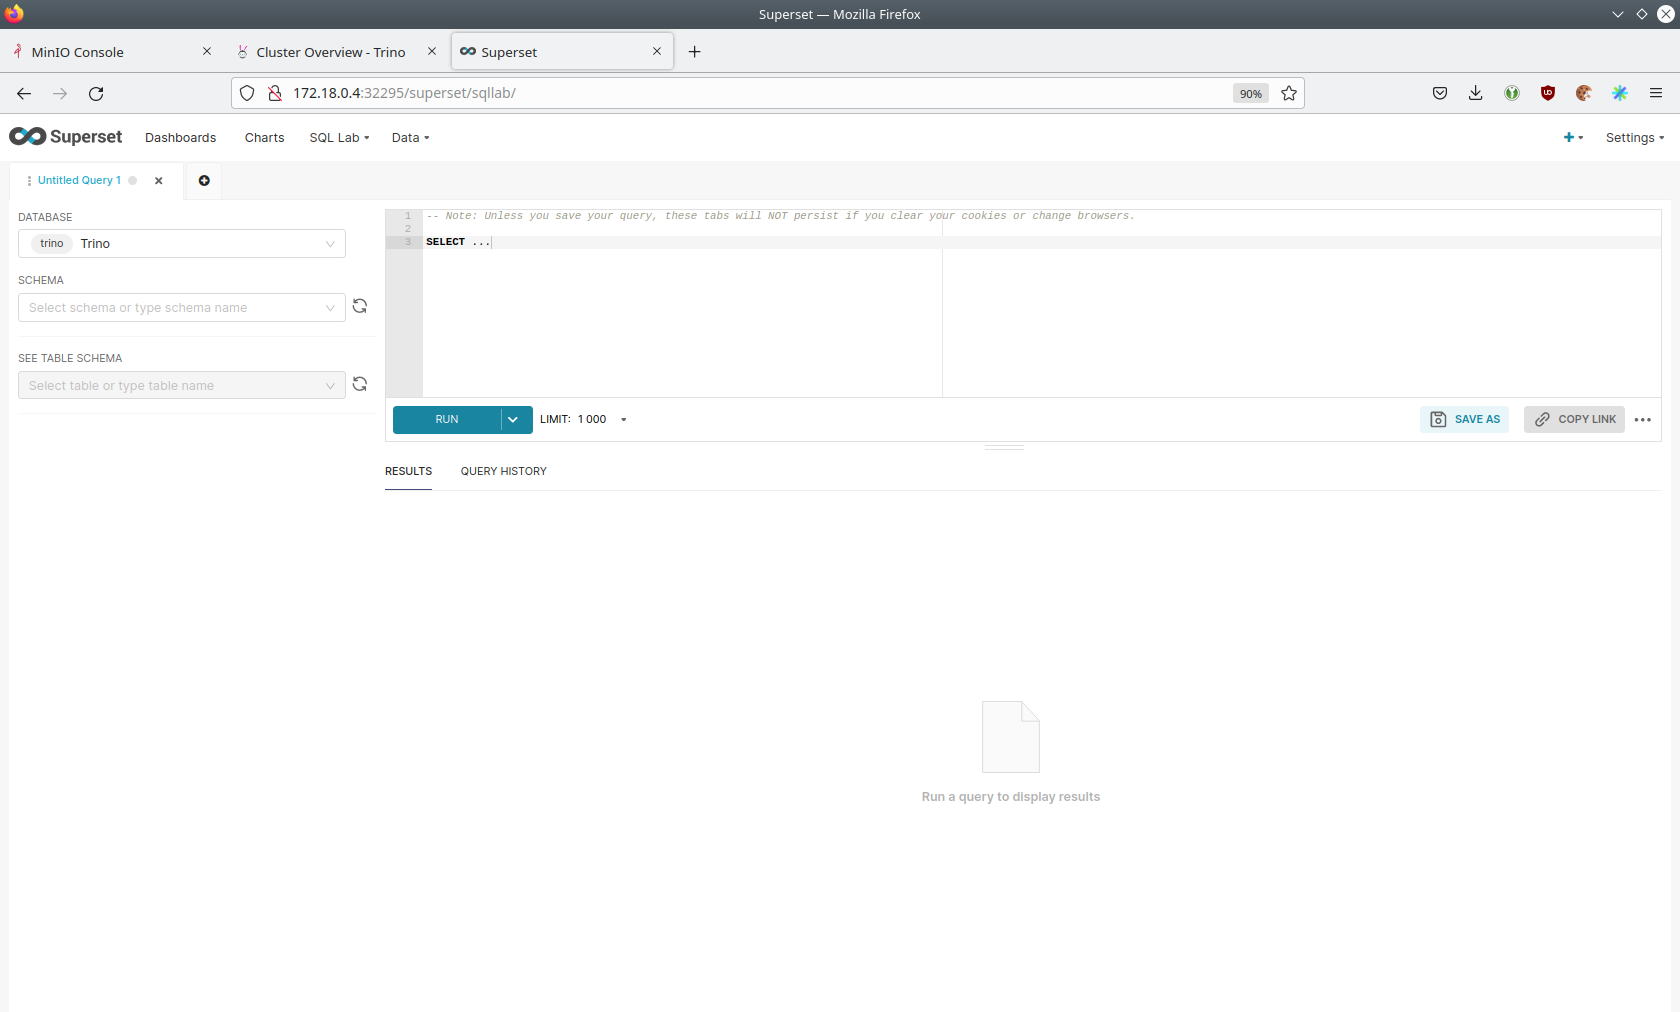
On the left, select the database Trino, the schema demo and set See table schema to ny_taxi_data.
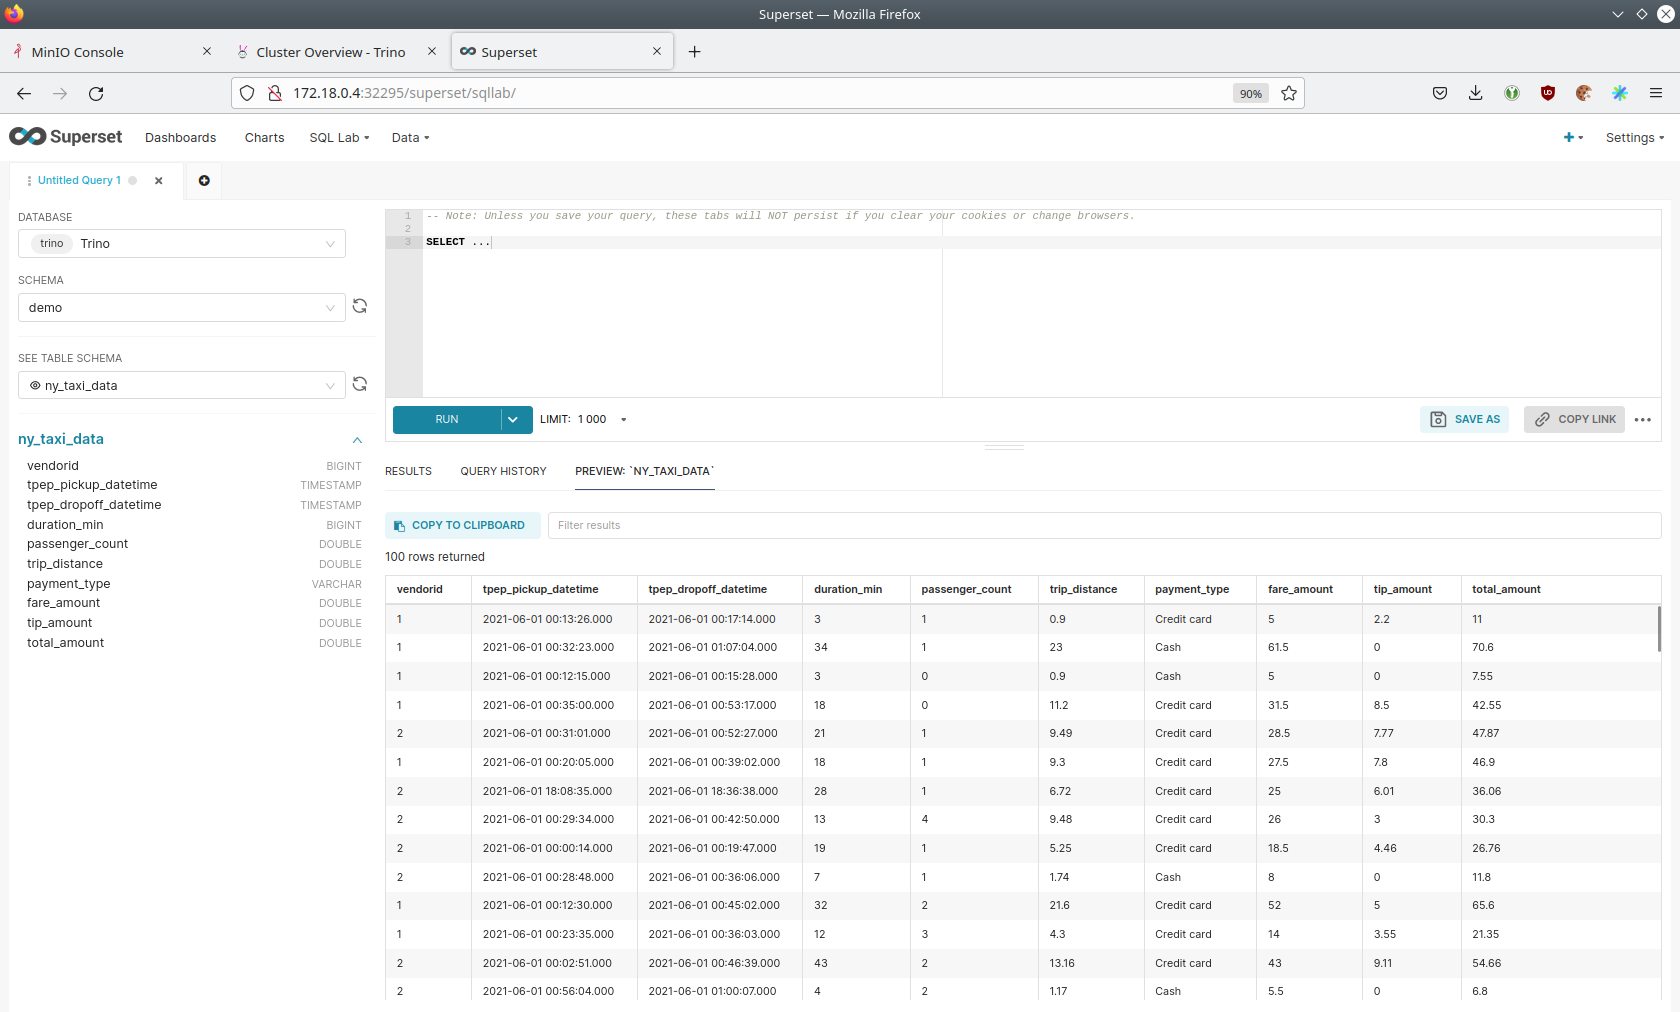
In the right textbox, enter the desired SQL statement. If you do not want to make on up, you can use the following:
select
  format_datetime(tpep_pickup_datetime, 'YYYY/MM') as month,
  count(*) as trips,
  sum(total_amount) as sales,
  avg(duration_min) as avg_duration_min
from ny_taxi_data
group by 1
order by 1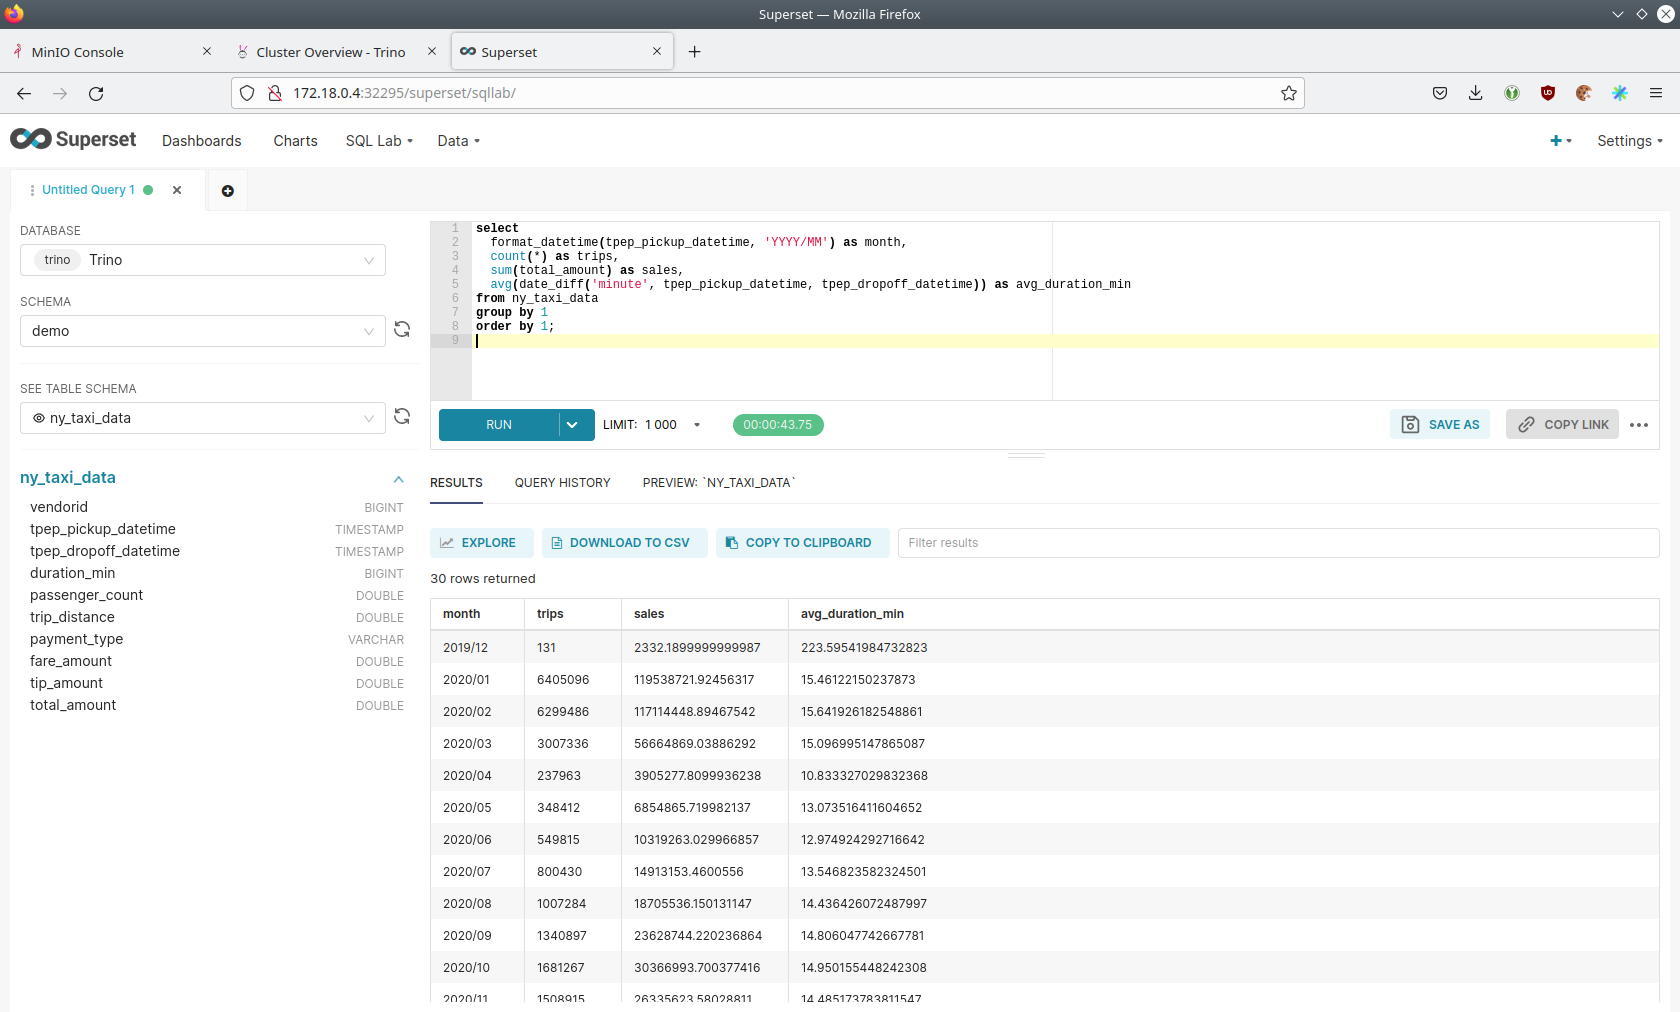
Summary
The demo loaded 2.5 years of taxi trip data from New York City with 68 million records and a total size of 1GB in parquet files. The data was put into the S3 storage. Trino enables you to query the data via SQL. Superset was used as a web-based frontend to execute SQL statements and build dashboards.
Where to go from here
There are multiple paths to go from here. The following sections can give you some ideas on what to explore next. You can find the description of the taxi data on the New York City website.
Execute Arbitrary SQL Statements
Within Superset you can execute arbitrary SQL statements to explore the taxi data. Can you answer the following questions by executing SQL statements? The Trino documentation on their SQL language might help you.
How many taxi trips there where in the year 2021?
See the answer
select
  count(*) as trips
from ny_taxi_data
where year(tpep_pickup_datetime) = 2021
returns 30.903.982 trips.
What was the maximum amount of passengers?
See the Answer
select
  max(passenger_count) as max_passenger_count
from ny_taxi_data;
Returns 112 passengers. Well that’s weird. Let’s examine the passengers distribution.
select
  passenger_count,
  count(*) as frequency
from ny_taxi_data
group by 1
order by 1 desc
limit 100
returns
 passenger_count | frequency
-----------------+-----------
           112.0 |         1
            96.0 |         1
             9.0 |        98
             8.0 |       156
             7.0 |       229
             6.0 |   1089568
             5.0 |   1715439
             4.0 |   1052834
             3.0 |   2504112
             2.0 |   9575299
             1.0 |  48133494
             0.0 |   1454268
            NULL |   2698591
We can see that one trip had 112 and another one 96 passengers. All the other trips start with a more "realistic" number of 9 passengers. As a bonus question: What exactly did the large number of passenger do?
select *
from ny_taxi_data
where passenger_count > 50
returns
 vendorid |  tpep_pickup_datetime   |  tpep_dropoff_datetime  | duration_min | passenger_count | trip_distance | payment_type | fare_amount | tip_amount | total_amount
----------+-------------------------+-------------------------+--------------+-----------------+---------------+--------------+-------------+------------+--------------
        2 | 2021-08-01 19:47:43.000 | 2021-08-01 19:57:54.000 |           10 |           112.0 |           1.8 | Credit card  |         9.0 |       2.46 |        14.76
        2 | 2021-08-03 11:51:58.000 | 2021-08-03 12:09:29.000 |           17 |            96.0 |          1.56 | Credit card  |        11.5 |       2.22 |        17.02
Pretty cheap for that amount of people! This probably are invalid records.
What was the highest tip (measured in percentage of the original fee) ever given?
See the Answer
select
  total_amount as fee,
  tip_amount as tip,
  tip_amount / total_amount * 100 as tip_percentage
from ny_taxi_data
where total_amount > 0
order by 3 desc
limit 5
returns
 fee  | tip  |   tip_percentage
------+------+--------------------
  4.2 | 10.0 |  238.0952380952381
 18.2 | 25.0 | 137.36263736263737
 8.24 | 9.24 | 112.13592233009709
 0.66 | 0.66 |              100.0
 0.01 | 0.01 |              100.0
Create Additional Dashboards
You also have the possibility to create additional charts and bundle them together in a Dashboard. Have a look at the Superset documentation on how to do that.
Load Additional Data
You can use the MinIO webinterface to upload additional data. As an alternative you can use the S3 API with an S3 client
like s3cmd. It is recommended to put the data into a folder (prefix) in the demo bucket.
Have a look at the defined tables inside the hive.demo schema on how to inform Trino about the newly available data.
Table Definitions
show create table hive.demo.ny_taxi_data_rawproduces something like
CREATE TABLE IF NOT EXISTS hive.demo.ny_taxi_data_raw (
  VendorID BIGINT,
  tpep_pickup_datetime TIMESTAMP,
  tpep_dropoff_datetime TIMESTAMP,
  passenger_count DOUBLE,
  trip_distance DOUBLE,
  payment_type BIGINT,
  Fare_amount DOUBLE,
  Tip_amount DOUBLE,
  Total_amount DOUBLE
) WITH (
  external_location = 's3a://demo/ny-taxi-data/raw/',
  format = 'parquet'
)
If you want to transform or filter your data in any way before using it e.g. in Superset you can create a view as follows:
show create view hive.demo.ny_taxi_dataproduces something like
create or replace view hive.demo.ny_taxi_data as
select
  vendorid,
  tpep_pickup_datetime,
  tpep_dropoff_datetime,
  date_diff('minute', tpep_pickup_datetime, tpep_dropoff_datetime) as duration_min,
  passenger_count,
  trip_distance,
  case payment_type when 1 then 'Credit card' when 2 then 'Cash' when 3 then 'No charge' when 4 then 'Dispute' when 6 then 'Voided trino' else 'Unknown' end as payment_type,
  fare_amount,
  tip_amount,
  total_amount
from hive.demo.ny_taxi_data_raw
where tpep_pickup_datetime >= from_iso8601_timestamp('2019-12-01T00:00:00')
and tpep_pickup_datetime <= from_iso8601_timestamp('2022-05-31T00:00:00')
Connect to Trino via CLI, Python or DBeaver
If you prefer running your SQL statements via command-line, a Python script or a graphical Database manager like DBeaver please have a look at the the Trino documentation on how to do that.