logging
This demo will
-
Install the required Stackable operators.
-
Spin up the following data products:
-
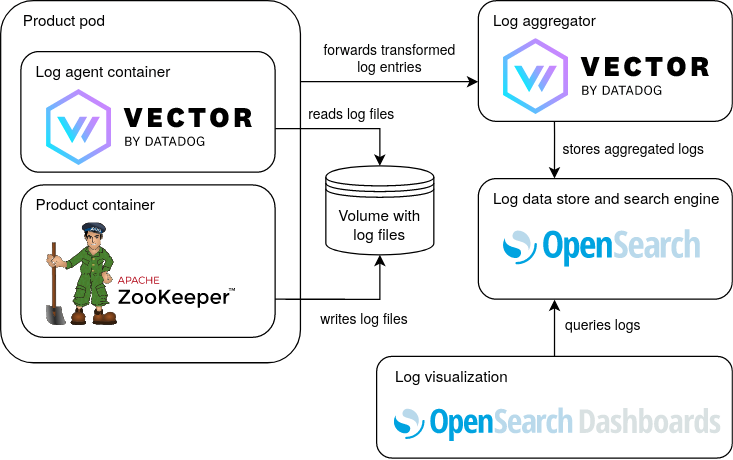
Apache ZooKeeper: A centralized service for maintaining configuration information, naming, providing distributed synchronization, and providing group services. This demo makes its log data observable in OpenSearch Dashboards.
-
Vector: A tool for building observability pipelines. This demo uses Vector as a log agent to gather and transform the logs and as an aggregator to forward the collected logs to OpenSearch.
-
OpenSearch: A data store and search engine. This demo uses it to store and index the of the log data.
-
OpenSearch Dashboards: A visualization and user interface. This demo uses it to make the log data easily accessible to the user.
-
-
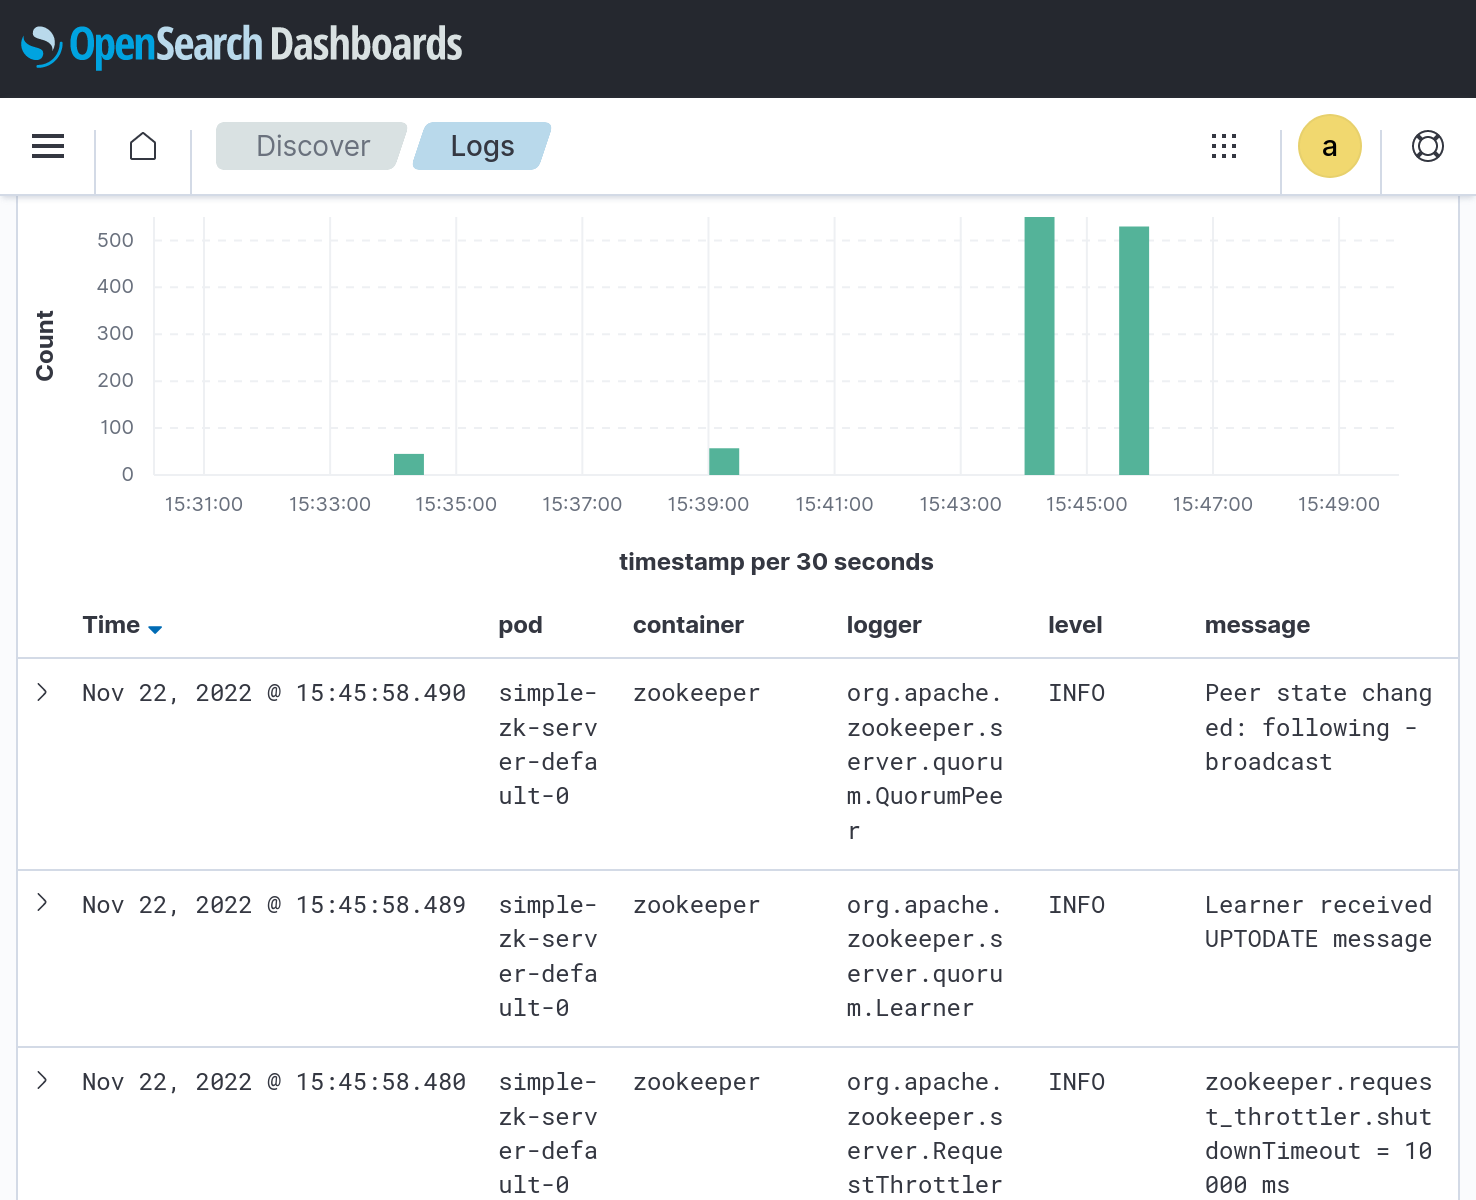
Create a view in OpenSearch Dashboards for convenient browsing the log data.
You can see the deployed products and their relationship in the following diagram:

OpenSearch Prerequisites
MacOS and Windows
If you use MacOS or Windows and use Docker to run Kubernetes, set the RAM to at least 4 GB in Preferences > Resources.
Linux
OpenSearch uses a mmapfs directory by default to store its indices. The default operating system limits on mmap counts
are likely too low - usually 65530, which may result in out-of-memory exceptions. So, the Linux setting
vm.max_map_count on the host machine where "kind" is running must be set to at least 262144.
To check the current value, run this command:
sysctl vm.max_map_countThe limit can be temporarily increased with:
sudo sysctl --write vm.max_map_count=262144To permanently increase the value, add the following line to /etc/sysctl.conf:
vm.max_map_count=262144Then run sudo sysctl --load to reload.
System Requirements
To run this demo, your system needs at least:
-
6.5 cpu units (core/hyperthread)
-
5GiB memory
-
27GiB disk storage
List Deployed Stacklets
To list the installed Stackable services run the following command:
$ stackablectl stacklets list
┌───────────────────────┬───────────────────────┬───────────┬──────────────────────────────┐
│ Product               ┆ Name                  ┆ Namespace ┆ Endpoints                    │
╞═══════════════════════╪═══════════════════════╪═══════════╪══════════════════════════════╡
│ opensearch-dashboards ┆ opensearch-dashboards ┆ default   ┆ http http://172.18.0.5:31319 │
│                       ┆                       ┆           ┆                              │
│                       ┆                       ┆           ┆                              │
├╌╌╌╌╌╌╌╌╌╌╌╌╌╌╌╌╌╌╌╌╌╌╌┼╌╌╌╌╌╌╌╌╌╌╌╌╌╌╌╌╌╌╌╌╌╌╌┼╌╌╌╌╌╌╌╌╌╌╌┼╌╌╌╌╌╌╌╌╌╌╌╌╌╌╌╌╌╌╌╌╌╌╌╌╌╌╌╌╌╌┤
│ zookeeper             ┆ simple-zk             ┆ default   ┆ zk   172.18.0.2:32417        │
└───────────────────────┴───────────────────────┴───────────┴──────────────────────────────┘|
When a product instance has not finished starting yet, the service will have no endpoint. Depending on your internet connectivity, creating all the product instances might take considerable time. A warning might be shown if the product is not ready yet. |
Inspect the Log Data
You can have a look at the log data within the OpenSearch Dashboards web interface by running
stackablectl stacklets list and opening the URL in the opensearch-dashboard entry’s info column. In this case, it is
http://172.18.0.5:31319/app/discover?security_tenant=global#/view/logs.

Log in with the username admin and password adminadmin.

Inspect the logs.