signal-processing
This demo can be installed on most cloud managed Kubernetes clusters as well as on premise or on a reasonably provisioned laptop. Install this demo on an existing Kubernetes cluster:
stackablectl demo install signal-processing|
This demo should not be run alongside other demos and requires a minimum of 32 GB RAM and 8 CPUs. |
Overview
This demo will do the following:
-
Install the required Stackable operators
-
Spin up the following data products
-
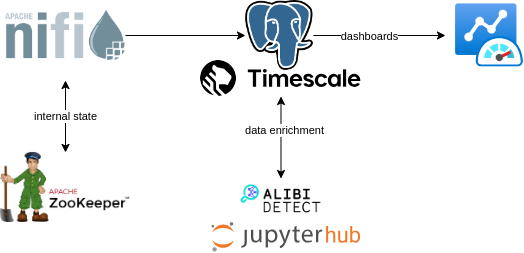
Apache NiFi: An easy-to-use, powerful system to process and distribute data. This demos uses it to fetch online data sources and ingest it into TimescaleDB. Nifi uses Apache ZooKeeper for maintaining state.
-
TimescaleDB: A layer of time-series tools extending Postgresql.
-
Grafana: A visualization engine for time-series data.
-
JupyterHub: A multi-user server for Jupyter notebooks.
-
-
Ingest time-series data to a timescaleDB hypertable
-
Install Jupyter notebook with a script to enrich this data with outlier detection data
-
Plot original and enriched data in pre-defined Grafana dashboards
You can see the deployed products as well as their relationship in the following diagram:

Data ingestion
The data used in this demo is a set of gas sensor measurements*. The dataset provides resistance values (r-values hereafter) for each of 14 gas sensors. In order to simulate near-real-time ingestion of this data, it is downloaded and batch-inserted into a Timescale table. It’s then updated in-place retaining the same time offsets but shifting the timestamps such that the notebook code can "move through" the data using windows as if it were being streamed. The Nifi flow that does this can easily be extended to process other sources of (actually streamed) data.
JupyterHub
JupyterHub will create a Pod for each active user. In order to reach the JupyterHub web interface, create a port-forward:
$ kubectl port-forward service/proxy-public 8000:httpNow access the JupyterHub web interface via:
http://localhost:8000
You should see the JupyterHub login page where you can login with username admin and password adminadmin.
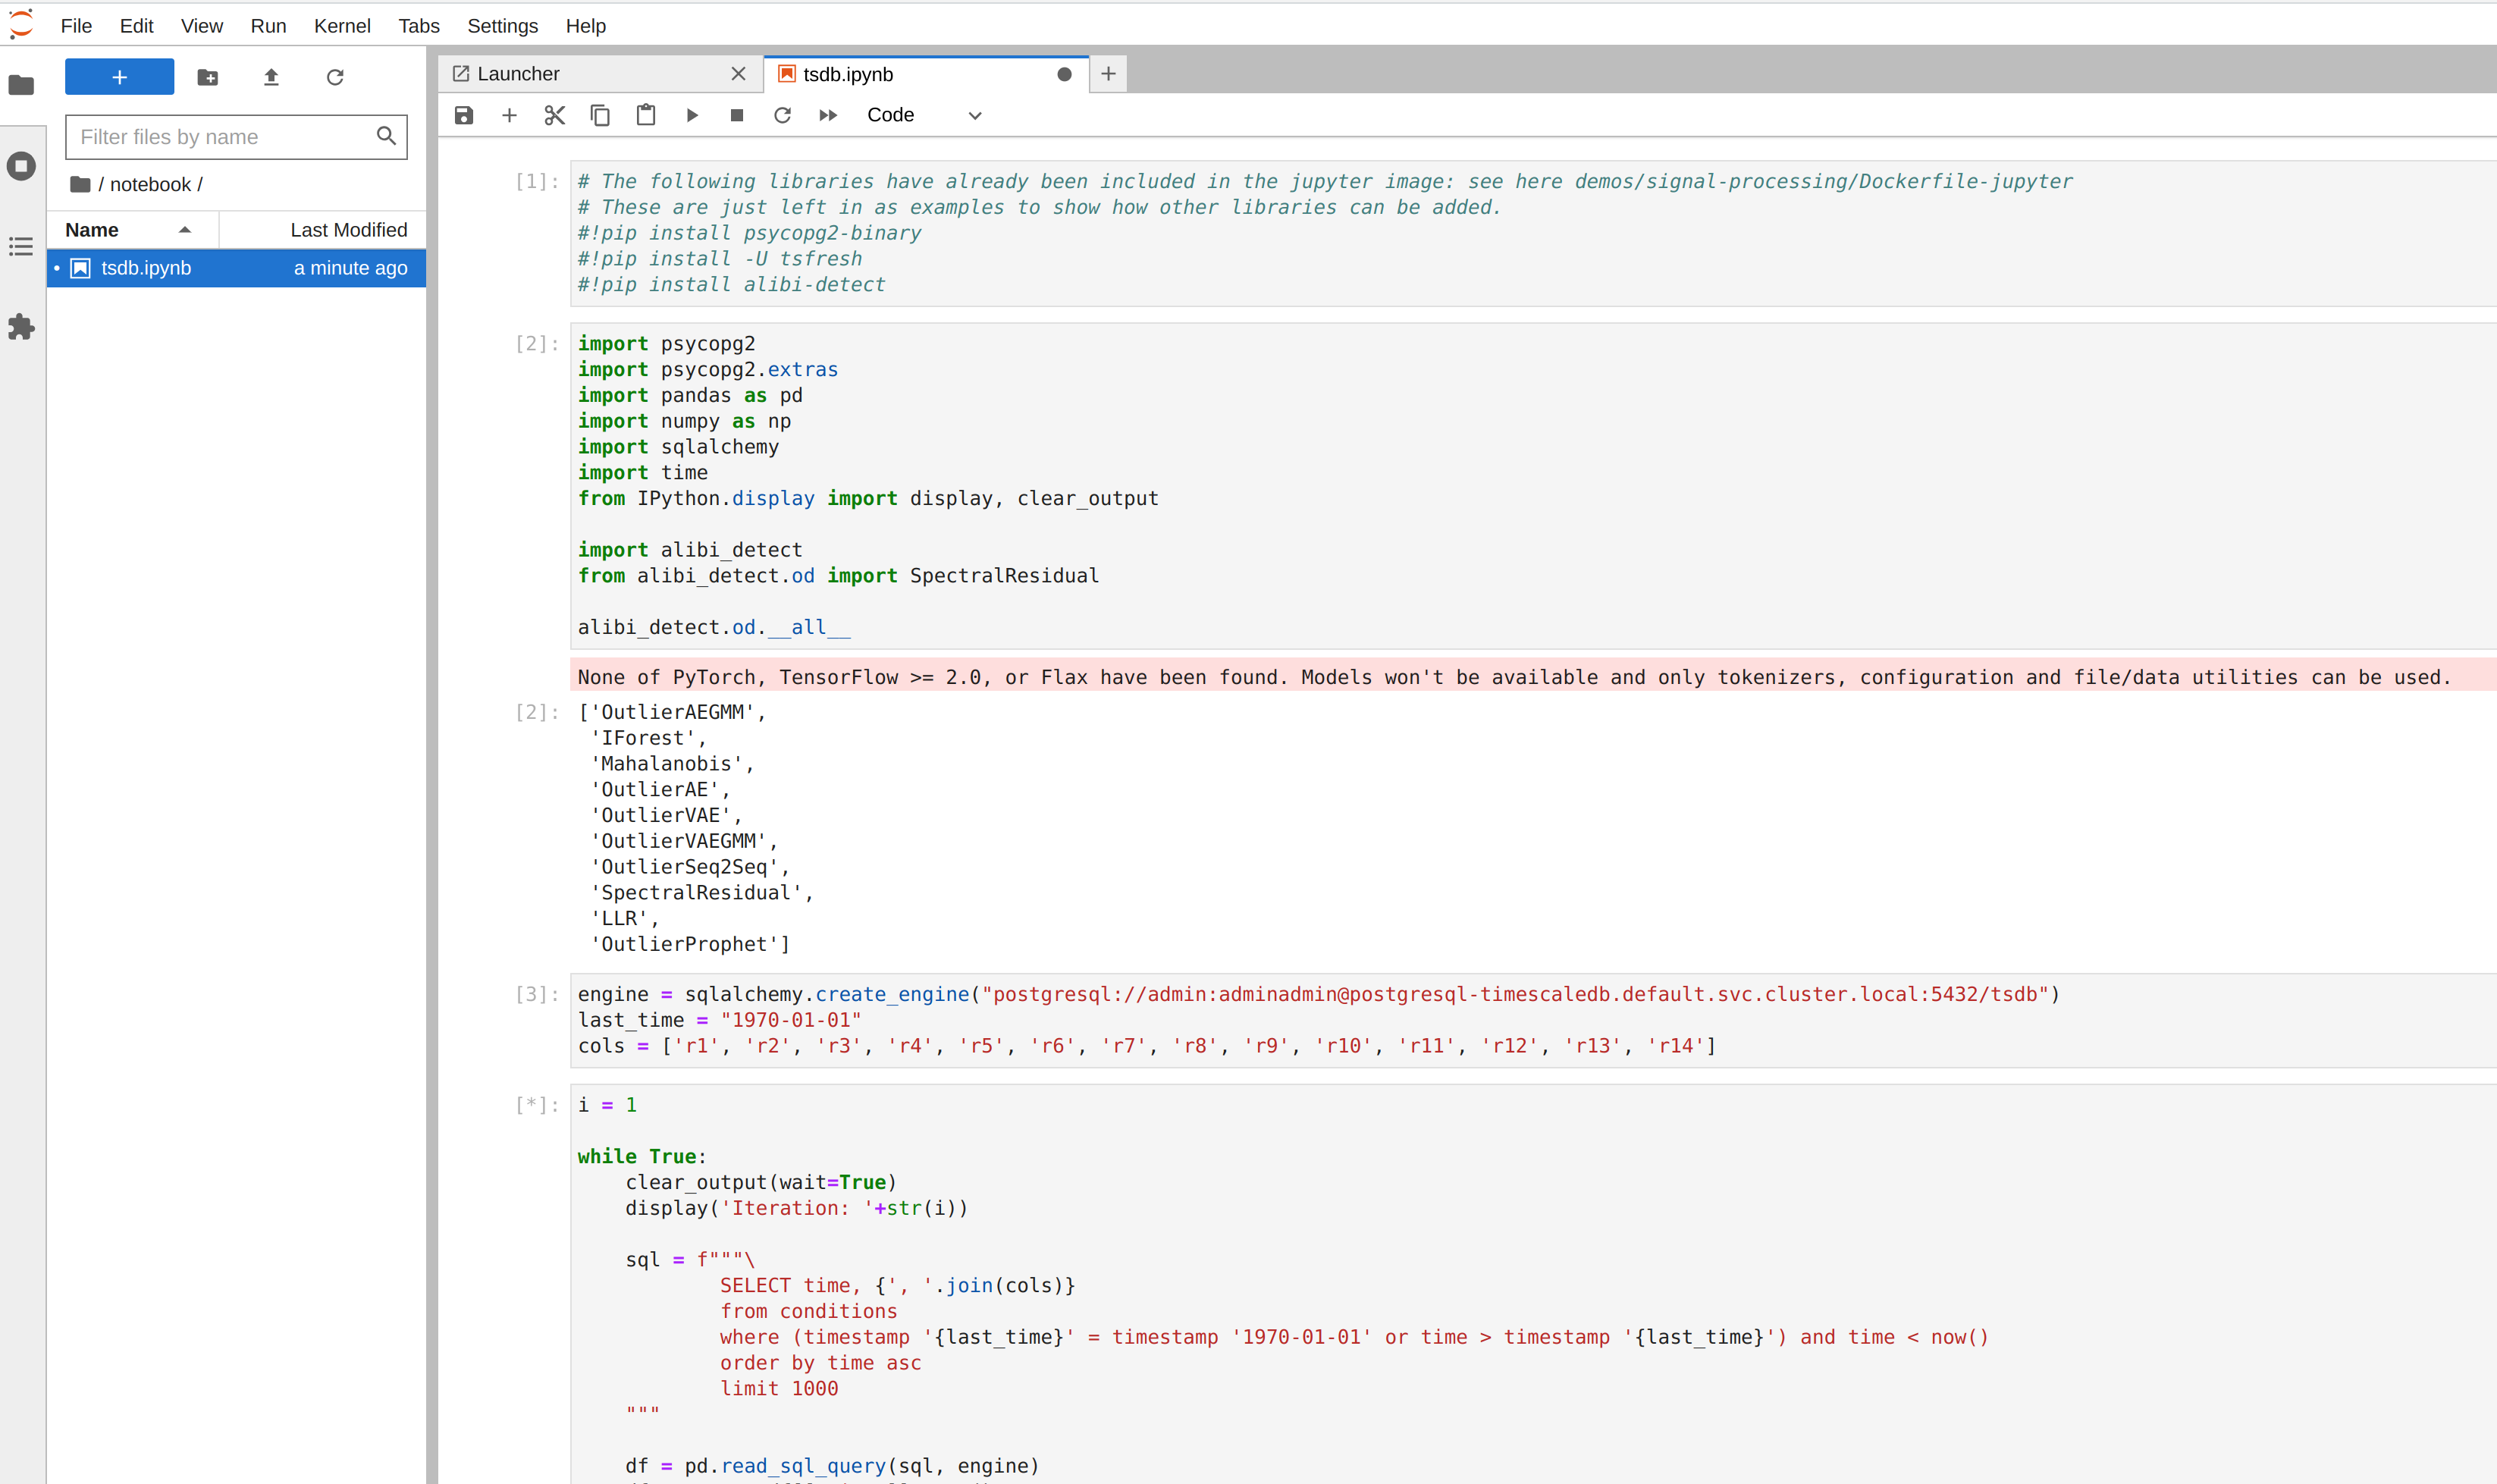
You should arrive at your workspace where you can click on the notebooks folder on the left, open the file and run it. Click on the double arrow to execute the Python scripts:

The notebook reads the measurement data in windowed batches using a loop, computes some predictions for each batch and persists the scores in a separate timescale table.
Model details
The enriched data is calculated using an online, unsupervised model that uses a technique called Spectral Residuals.
-
online: in this context this means that the model does not require a training phase and can apply the algorithm to a batch in isolation. However, a light-weight training phase can be introduced if an estimated threshold value is required. This would take the form of a single batch "up front" used to determine some baselines. This is not implemented in this demo. -
unsupervised: the data is not labelled and the algorithm seeks to extract useful information (alerts etc.) from the raw data alone. -
spectral residuals: this algorithm executes a double Fourier transformation to reconstruct the original data, with the reconstruction error being used as a measure of outlier-ness.
Visualization
Grafana can be reached by first looking up the service endpoint:
$ stackablectl stacklet list
┌───────────┬───────────┬───────────┬──────────────────────────────────┬─────────────────────────────────────────┐
│ Product   ┆ Name      ┆ Namespace ┆ Endpoints                        ┆ Info                                    │
╞═══════════╪═══════════╪═══════════╪══════════════════════════════════╪═════════════════════════════════════════╡
│ nifi      ┆ nifi      ┆ default   ┆ https   https://172.19.0.3:30176 ┆                                         │
├╌╌╌╌╌╌╌╌╌╌╌┼╌╌╌╌╌╌╌╌╌╌╌┼╌╌╌╌╌╌╌╌╌╌╌┼╌╌╌╌╌╌╌╌╌╌╌╌╌╌╌╌╌╌╌╌╌╌╌╌╌╌╌╌╌╌╌╌╌╌┼╌╌╌╌╌╌╌╌╌╌╌╌╌╌╌╌╌╌╌╌╌╌╌╌╌╌╌╌╌╌╌╌╌╌╌╌╌╌╌╌╌┤
│ zookeeper ┆ zookeeper ┆ default   ┆                                  ┆                                         │
├╌╌╌╌╌╌╌╌╌╌╌┼╌╌╌╌╌╌╌╌╌╌╌┼╌╌╌╌╌╌╌╌╌╌╌┼╌╌╌╌╌╌╌╌╌╌╌╌╌╌╌╌╌╌╌╌╌╌╌╌╌╌╌╌╌╌╌╌╌╌┼╌╌╌╌╌╌╌╌╌╌╌╌╌╌╌╌╌╌╌╌╌╌╌╌╌╌╌╌╌╌╌╌╌╌╌╌╌╌╌╌╌┤
│ grafana   ┆ grafana   ┆ default   ┆ service 172.19.0.3:30387         ┆ Third party service                     │
│           ┆           ┆           ┆                                  ┆ Admin user: admin, password: adminadmin │
└───────────┴───────────┴───────────┴──────────────────────────────────┴─────────────────────────────────────────┘
Log in to Grafana with username admin and password adminadmin and navigate to the dashboards. There are two located in the "Stackable Data Platform" folder.
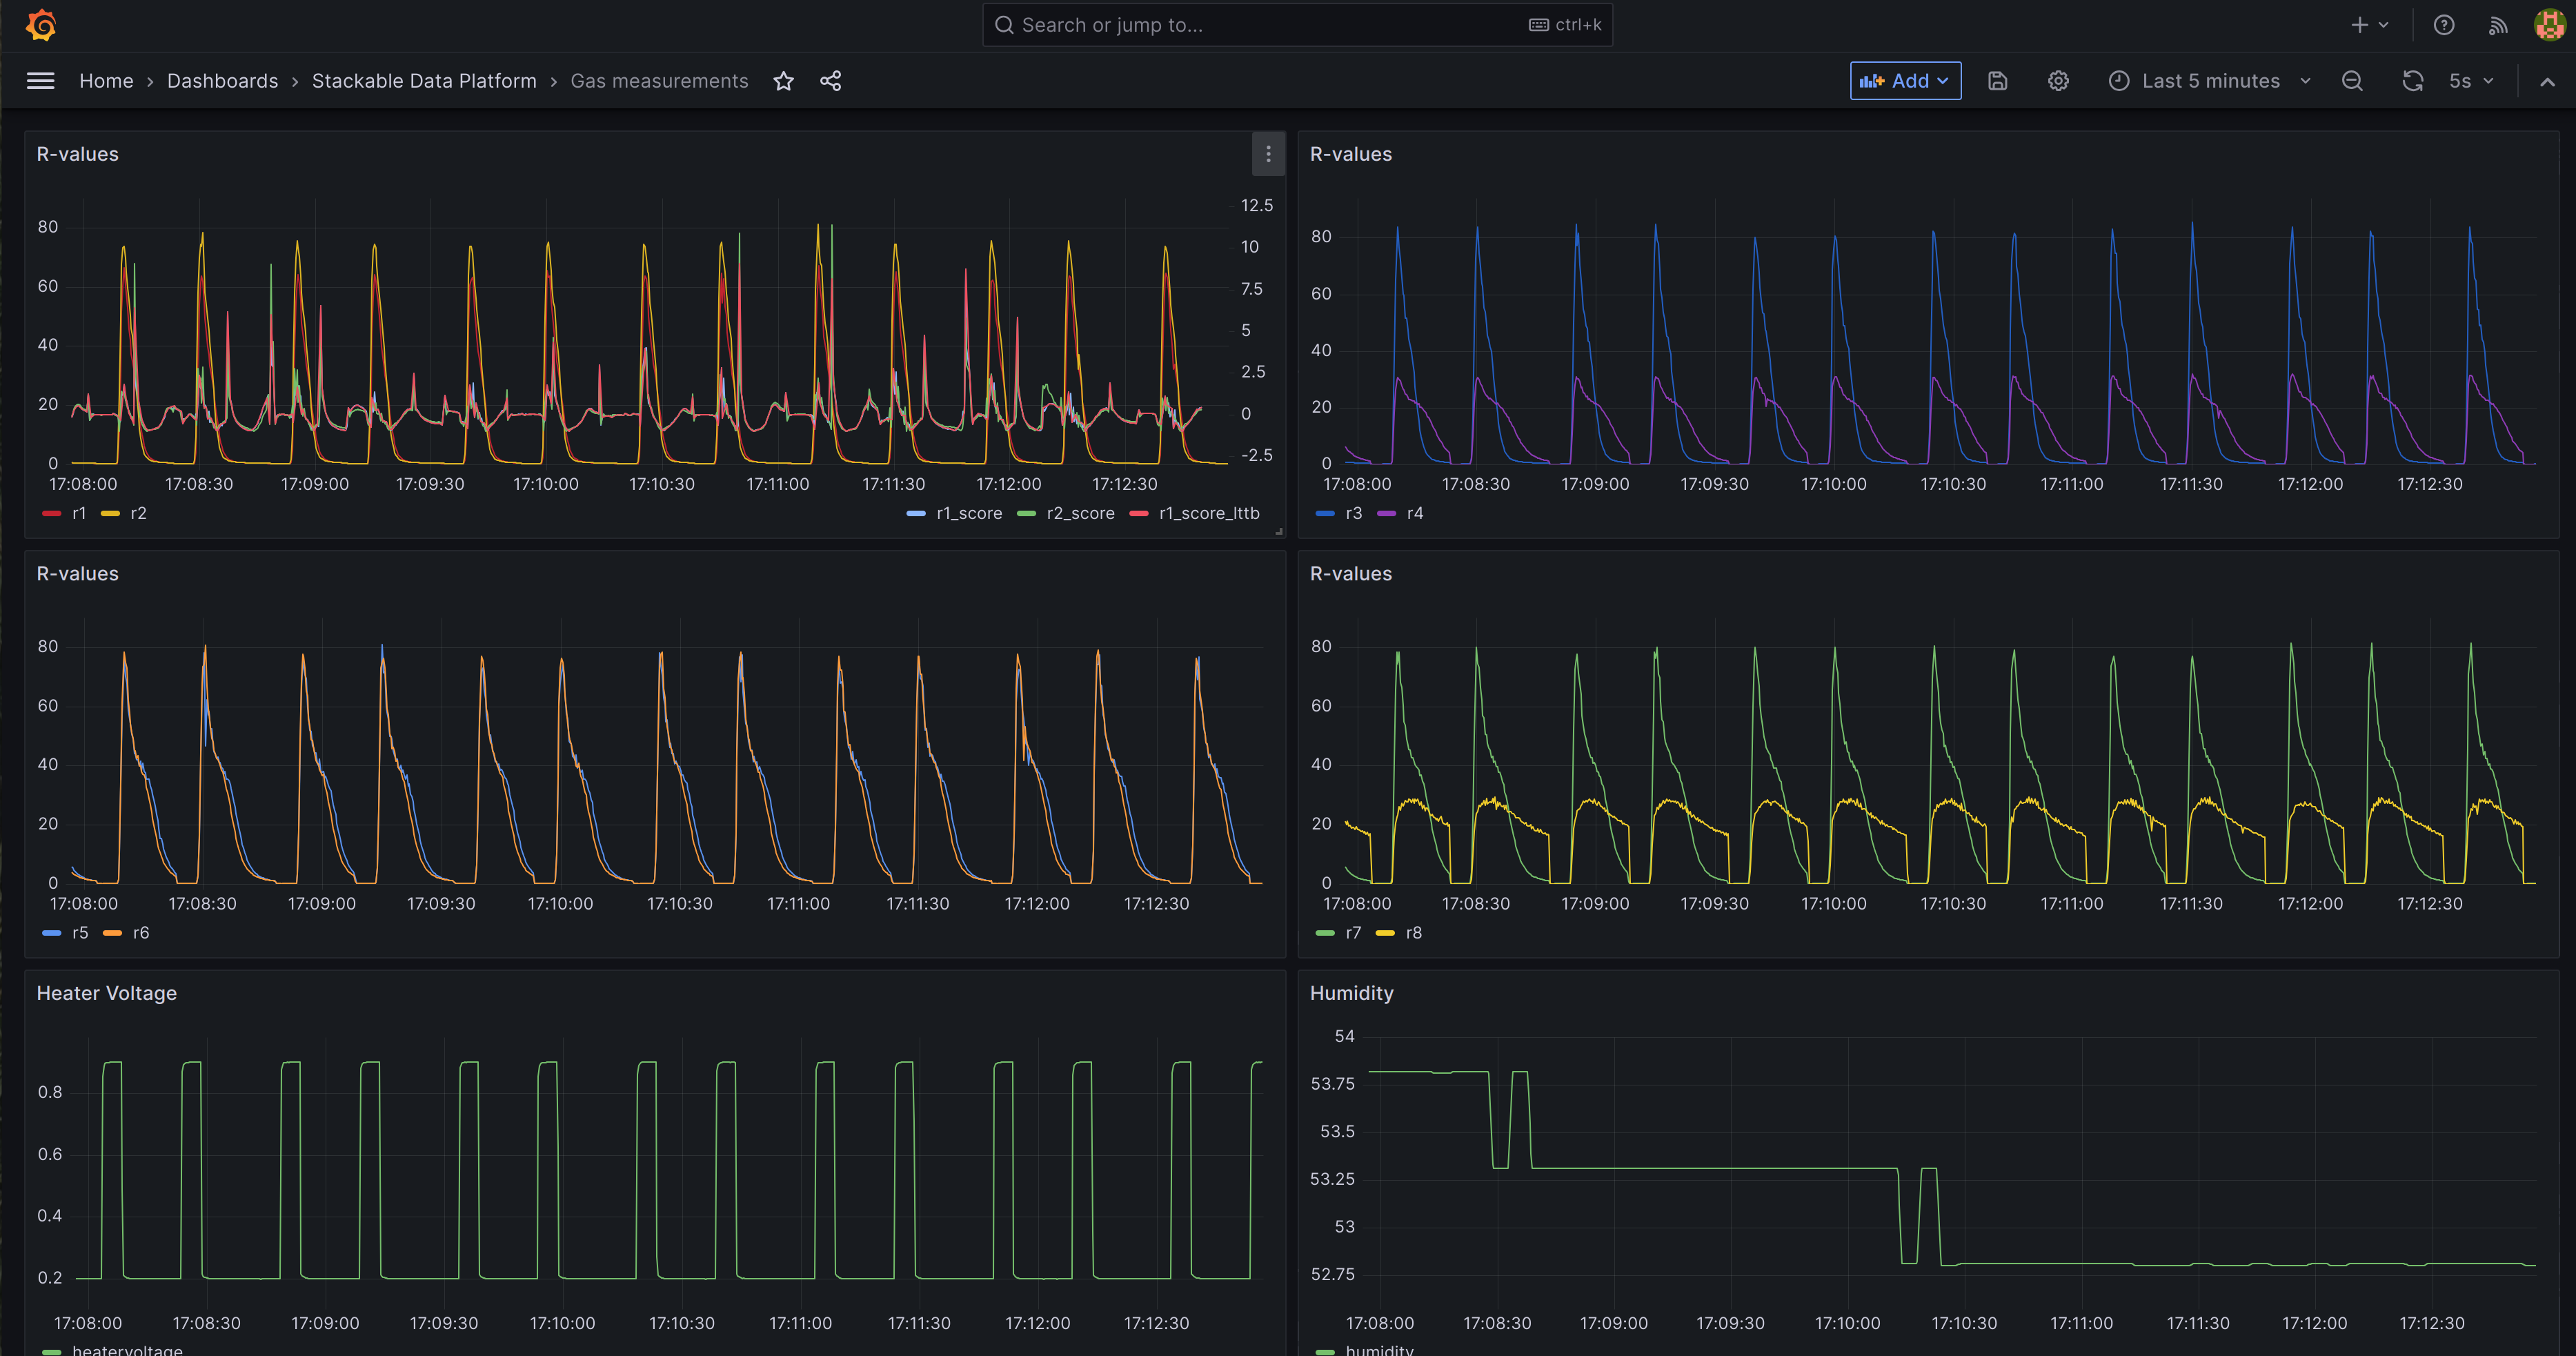
Measurements
This is the original data. The first graph plots two measurments (r1, r2), togther with the model scores (r1_score, r2_score, r1_score_lttb). These are superimposed on each other for ease of comparison.

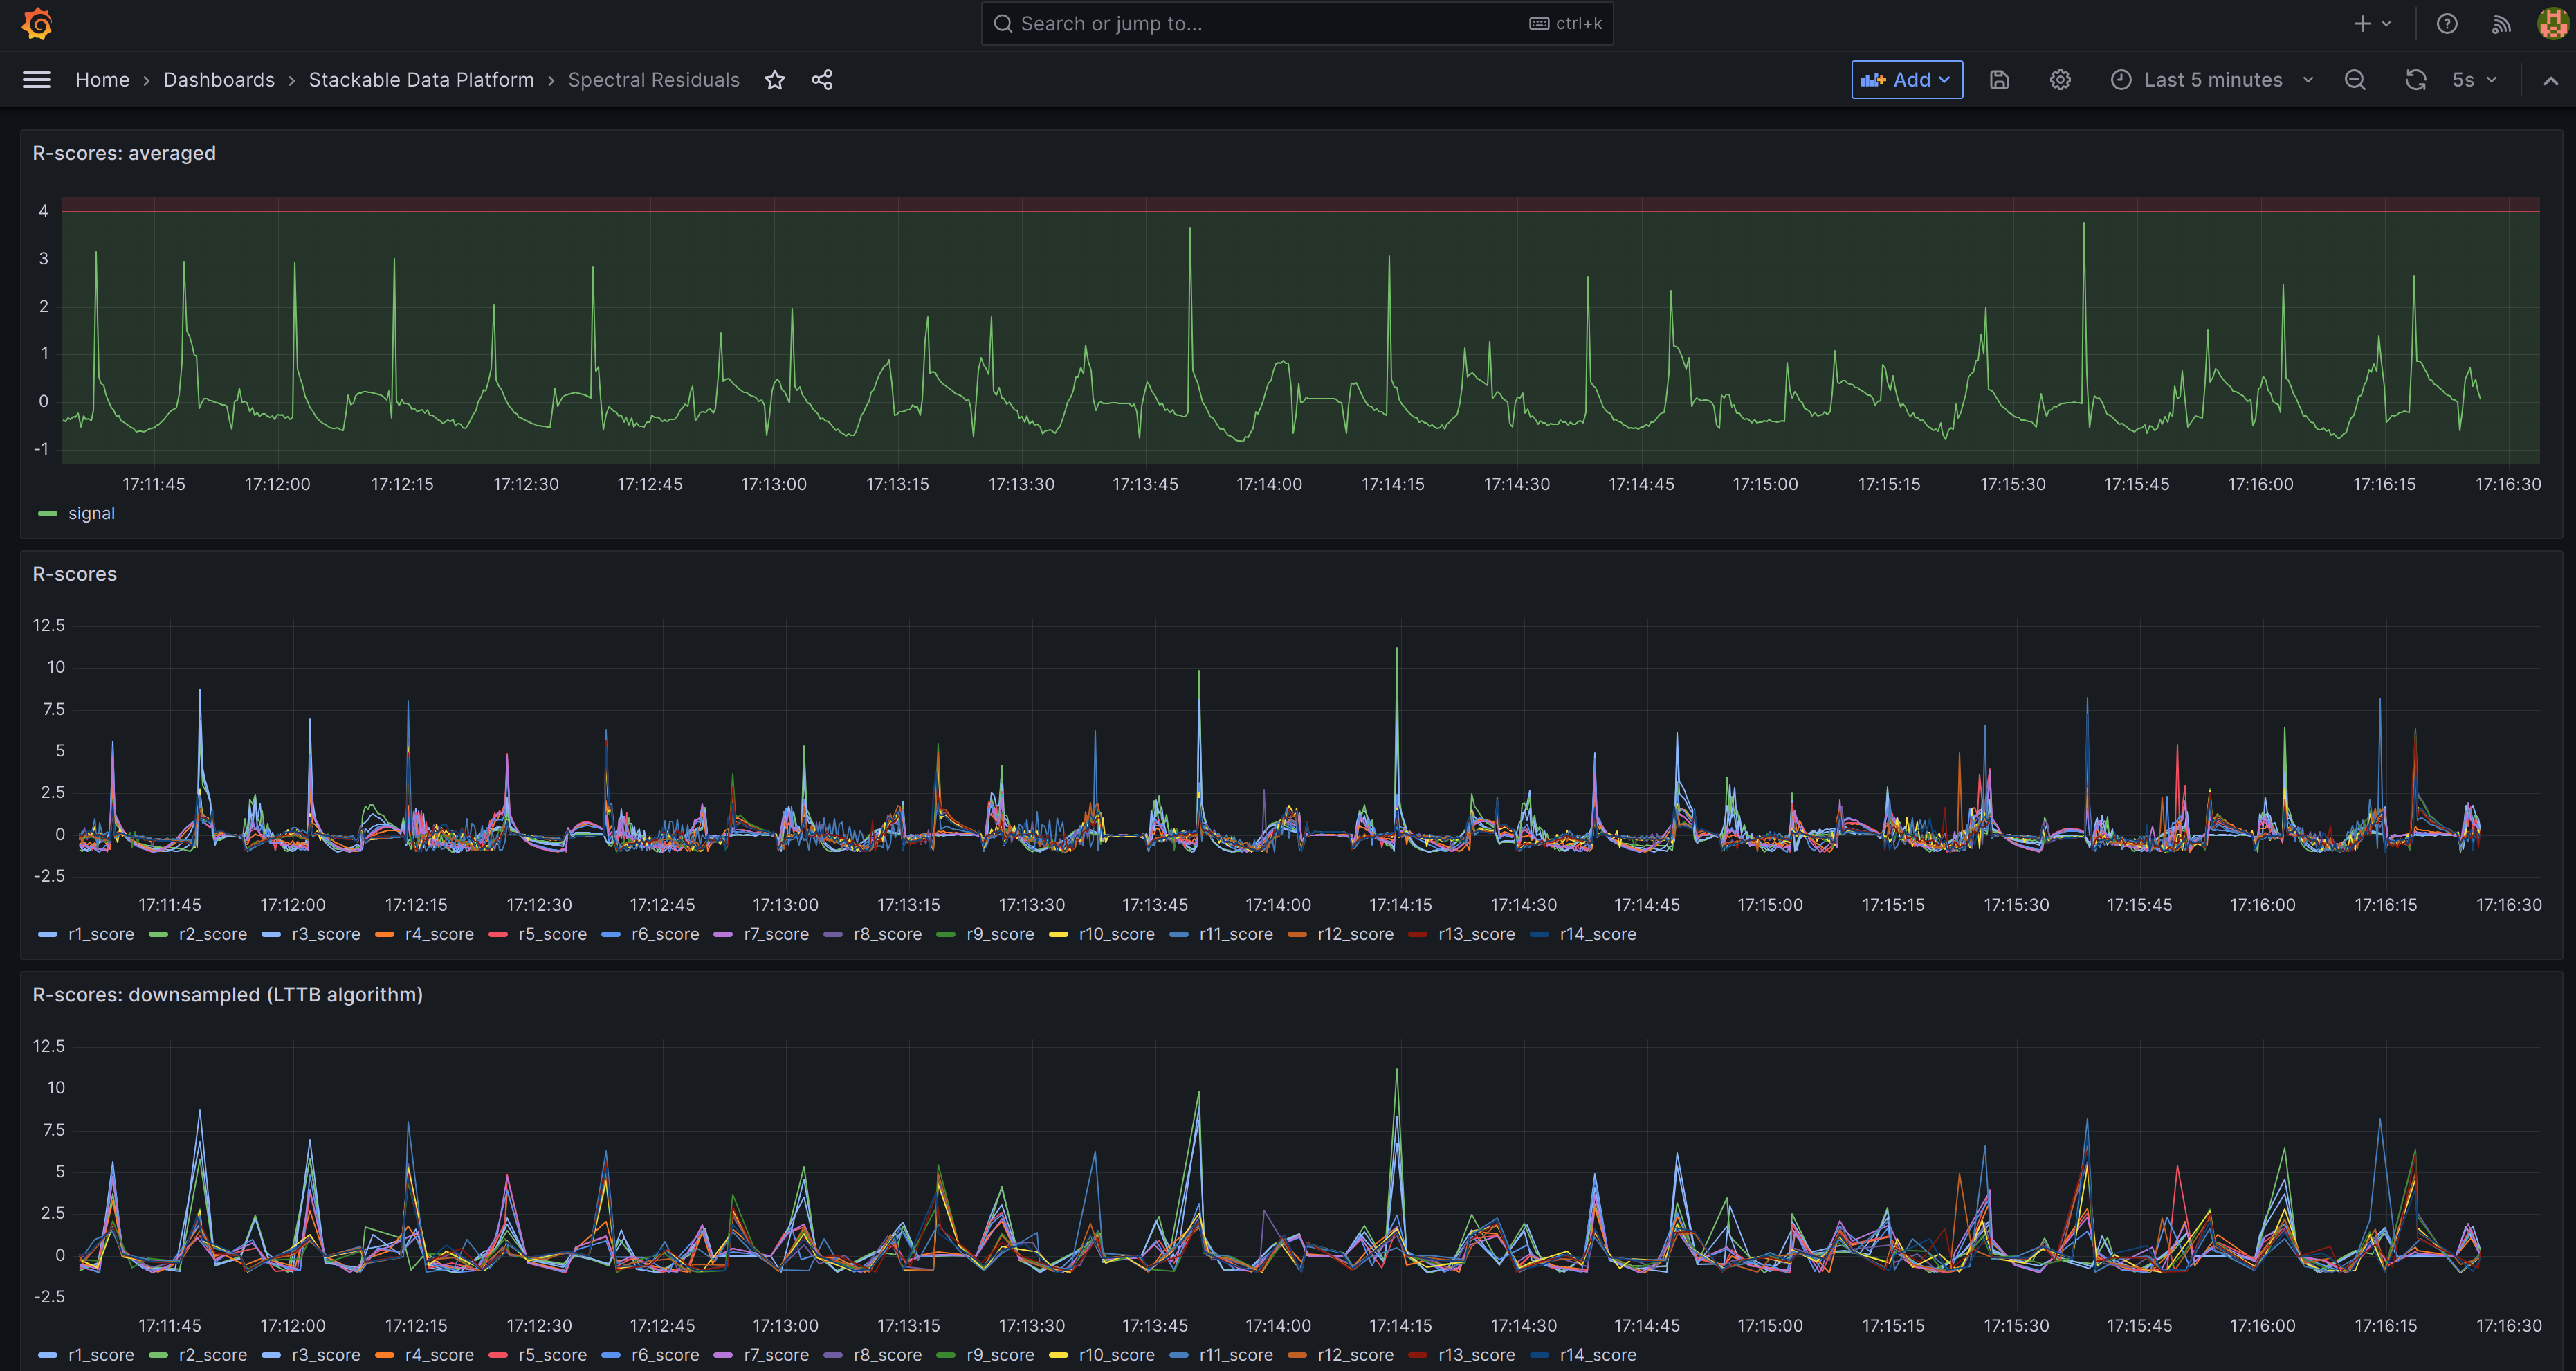
Predictions
In this second dashboard the predictions for all r-values are plotted: the top graph takes an average across all measurements, with a threshold marked as a red line across the top. This can be used for triggering email alerts. Underneath the individual r-values are plotted, firstly as raw data and then the same using downsampling. Downsampling uses a built-in Timescale extension to significantly reduce the number of data plotted while retaining the same overall shape.

*See: Burgués, Javier, Juan Manuel Jiménez-Soto, and Santiago Marco. "Estimation of the limit of detection in semiconductor gas sensors through linearized calibration models." Analytica chimica acta 1013 (2018): 13-25 Burgués, Javier, and Santiago Marco. "Multivariate estimation of the limit of detection by orthogonal partial least squares in temperature-modulated MOX sensors." Analytica chimica acta 1019 (2018): 49-64.