airflow-scheduled-job
This demo will
-
Install the required Stackable operators
-
Spin up the following data products
-
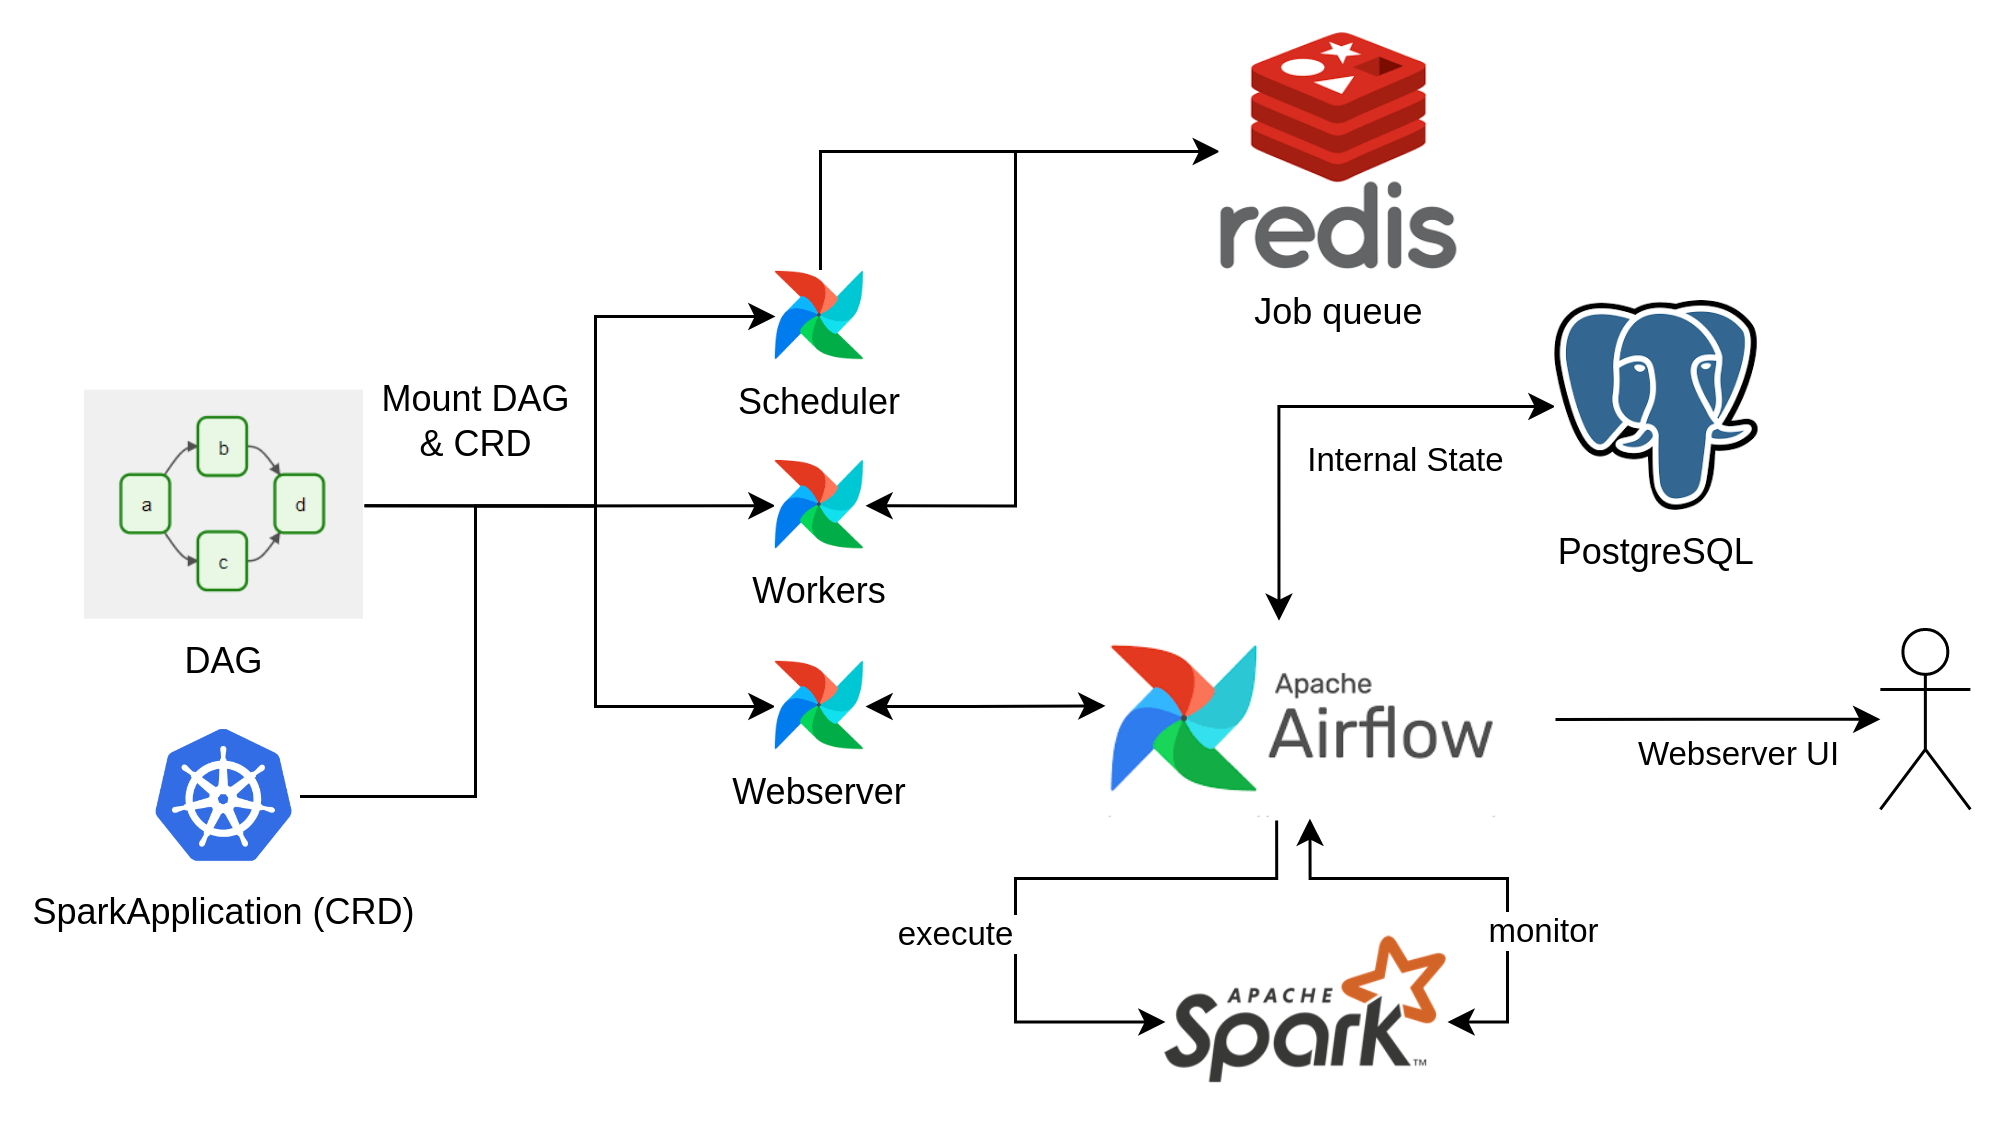
Postgresql: An open-source database used for Airflow cluster and job metadata.
-
Redis: An in-memory data structure store used for queuing Airflow jobs
-
Airflow: An open-source workflow management platform for data engineering pipelines.
-
-
Mount two Airflow jobs (referred to as Directed Acyclic Graphs, or DAGs) for the cluster to use
-
Enable and schedule the jobs
-
Verify the job status with the Airflow Webserver UI
You can see the deployed products and their relationship in the following diagram:
System Requirements
To run this demo, your system needs at least:
-
2.5 cpu units (core/hyperthread)
-
9GiB memory
-
24GiB disk storage
List deployed Stackable services
To list the installed Stackable services run the following command:
$ stackablectl stacklets list
┌──────────┬───────────────┬───────────┬───────────────────────────────────────────┬─────────────────────────────────┐
│ PRODUCT  ┆ NAME          ┆ NAMESPACE ┆ ENDPOINTS                                 ┆ CONDITIONS                      │
╞══════════╪═══════════════╪═══════════╪═══════════════════════════════════════════╪═════════════════════════════════╡
│ airflow  ┆ airflow       ┆ default   ┆ webserver-airflow http://172.18.0.2:31979 ┆ Available, Reconciling, Running │
└──────────┴───────────────┴───────────┴───────────────────────────────────────────┴─────────────────────────────────┘|
When a product instance has not finished starting yet, the service will have no endpoint. Depending on your internet connectivity, creating all the product instances might take considerable time. A warning might be shown if the product is not ready yet. |
Airflow Webserver UI
Superset gives the ability to execute SQL queries and build dashboards. Open the airflow endpoint webserver-airflow
in your browser (http://172.18.0.2:31979 in this case).

Log in with the username admin and password adminadmin. The overview screen shows the DAGs mounted during the demo
setup (date_demo).

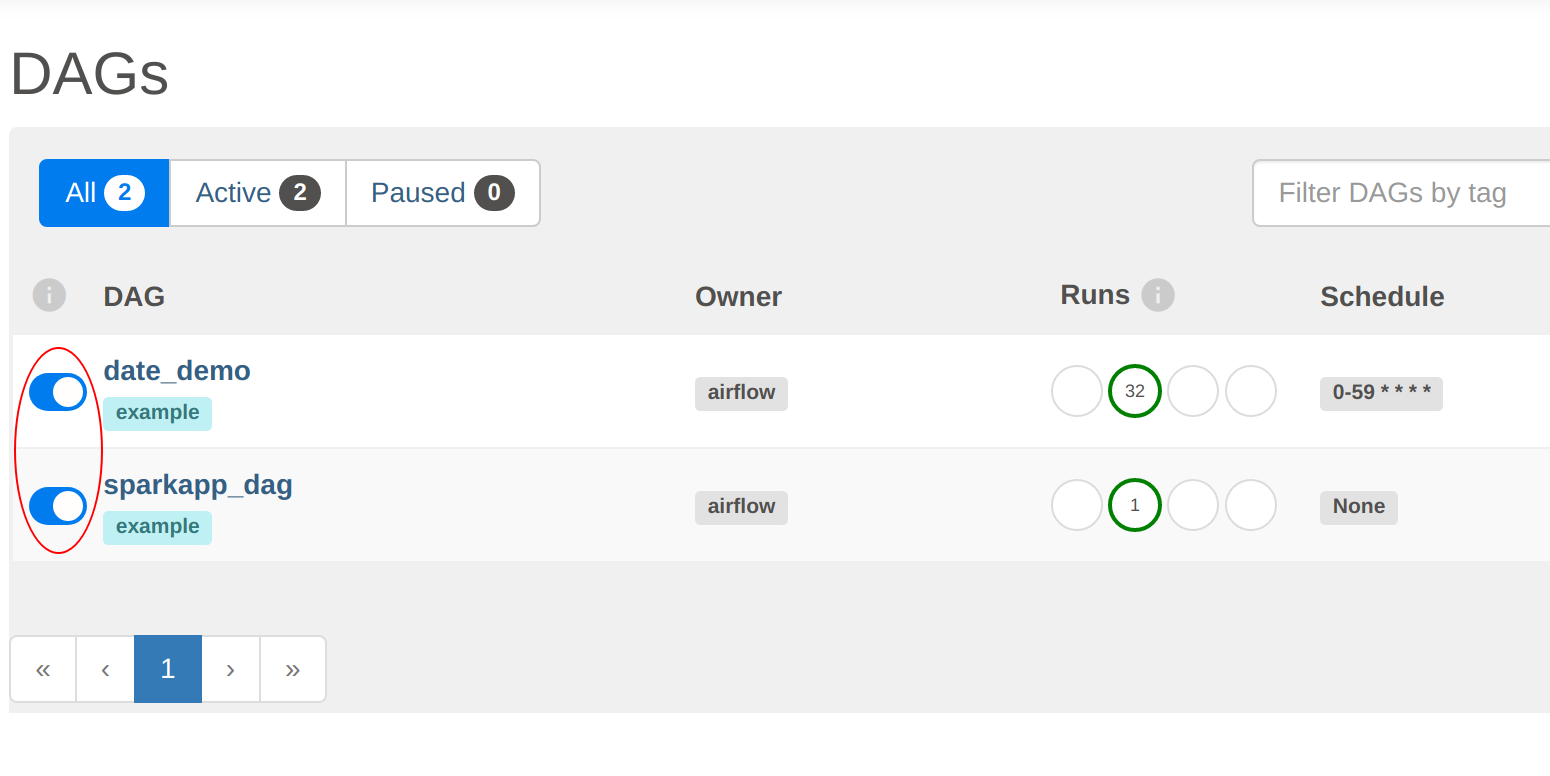
There are two things to notice here. Both DAGs have been enabled, as shown by the slider to the left of the DAG name
(DAGs are all paused initially and can be activated manually in the UI or via a REST call, as done in the setup for
this demo):
Secondly, the date_demo job has been busy, with several runs already logged. The sparkapp_dag has only been run
once because they have been defined with different schedules.
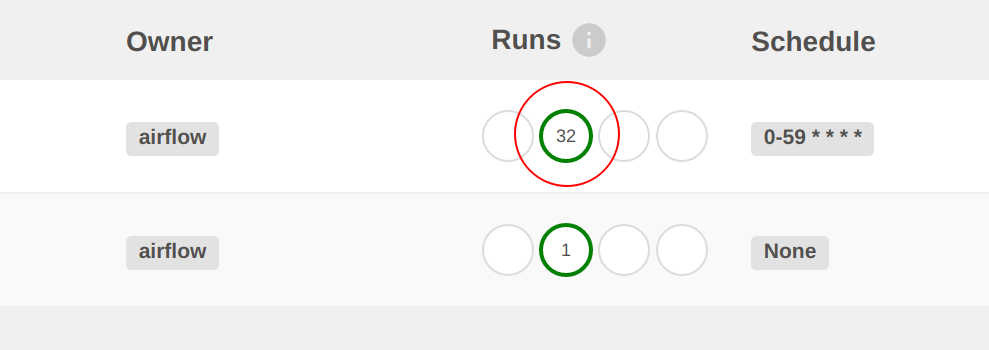
Clicking on the number under Runs will display the individual job runs:
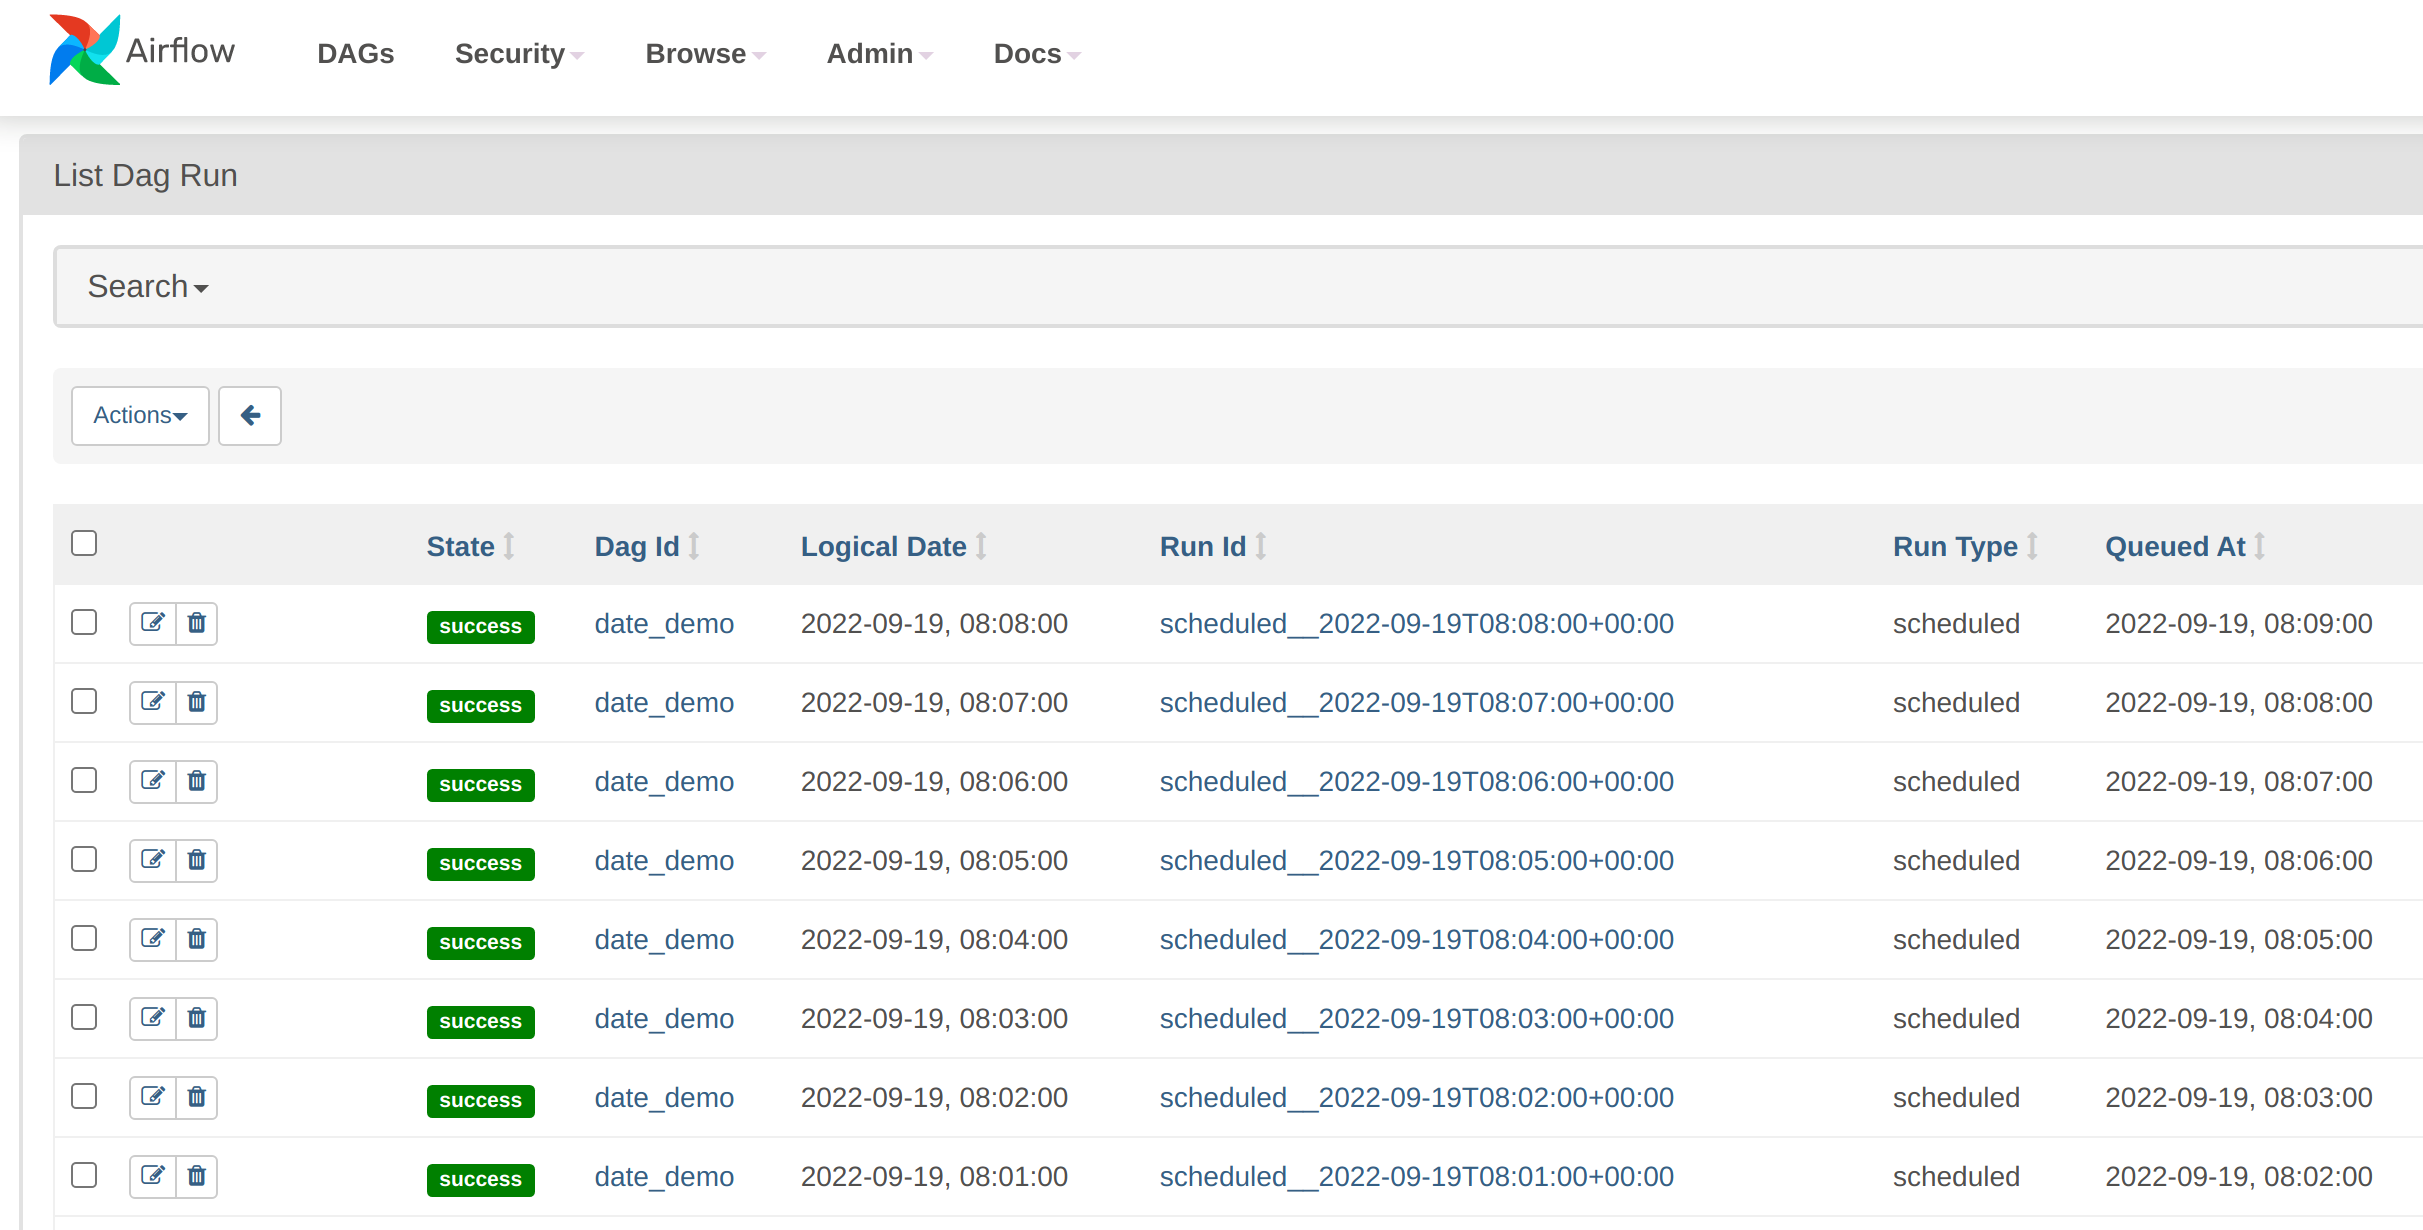
The demo_date job is running every minute. With Airflow, DAGs can be started manually or scheduled to run when certain
conditions are fulfilled- In this case, the DAG has been set up to run using a cron table, which is part of the DAG
definition.
demo_date DAG
Let’s drill down a bit deeper into this DAG. Click on one of the job runs shown in the previous step to display the
details. The DAG is displayed as a graph (this job is so simple that it only has one step, called run_every_minute).

In the top right-hand corner there is some scheduling information, which tells us that this job will run every minute continuously:

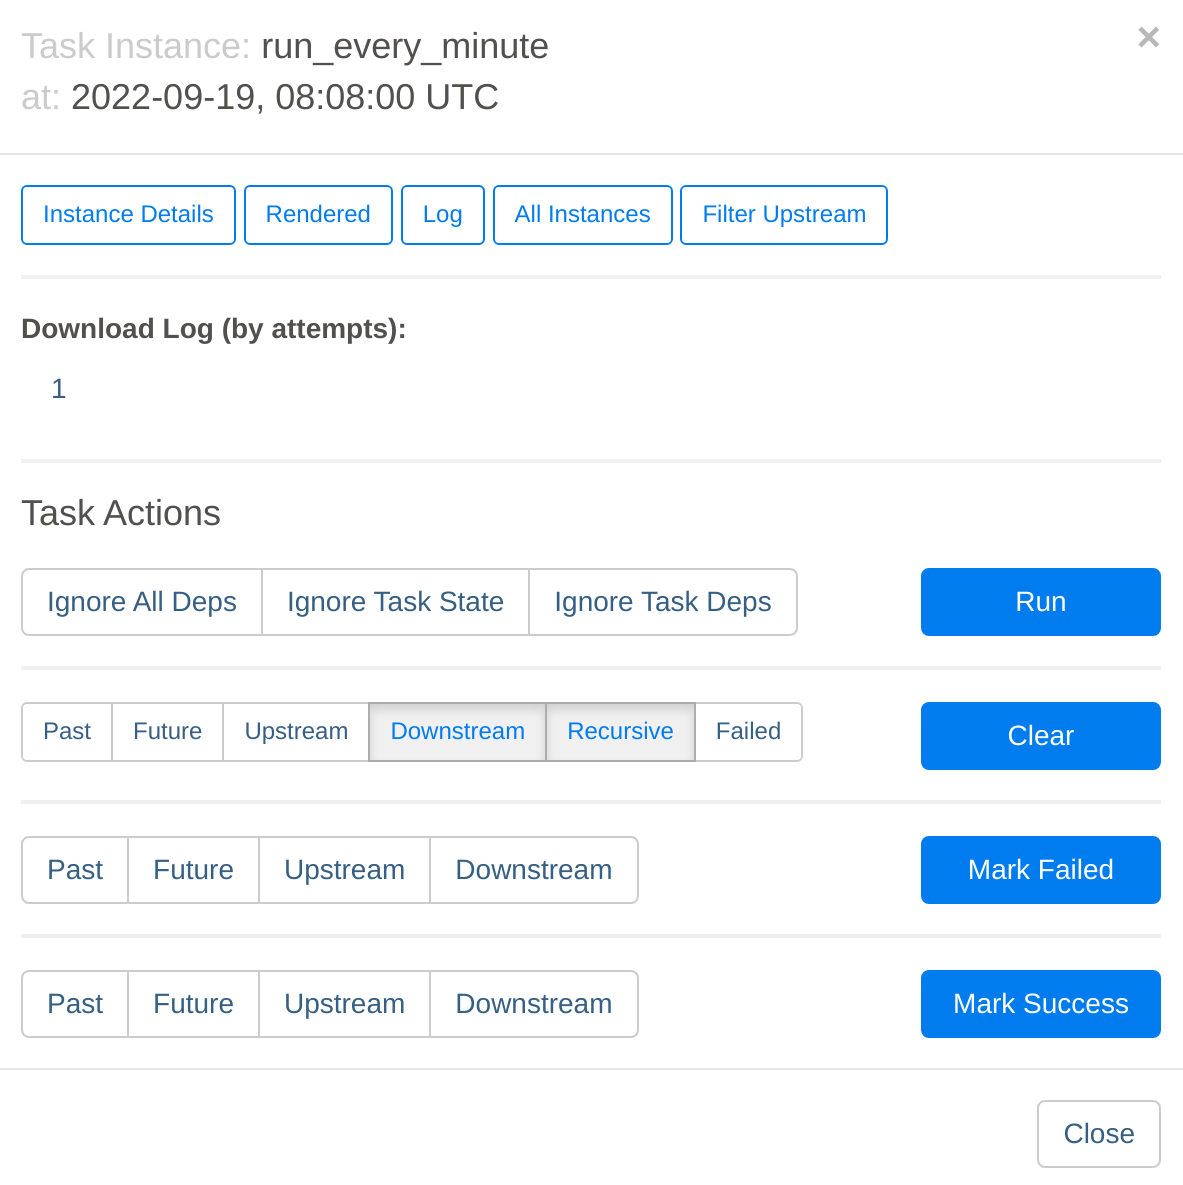
Click on the run_every_minute box in the centre of the page and then select Log:
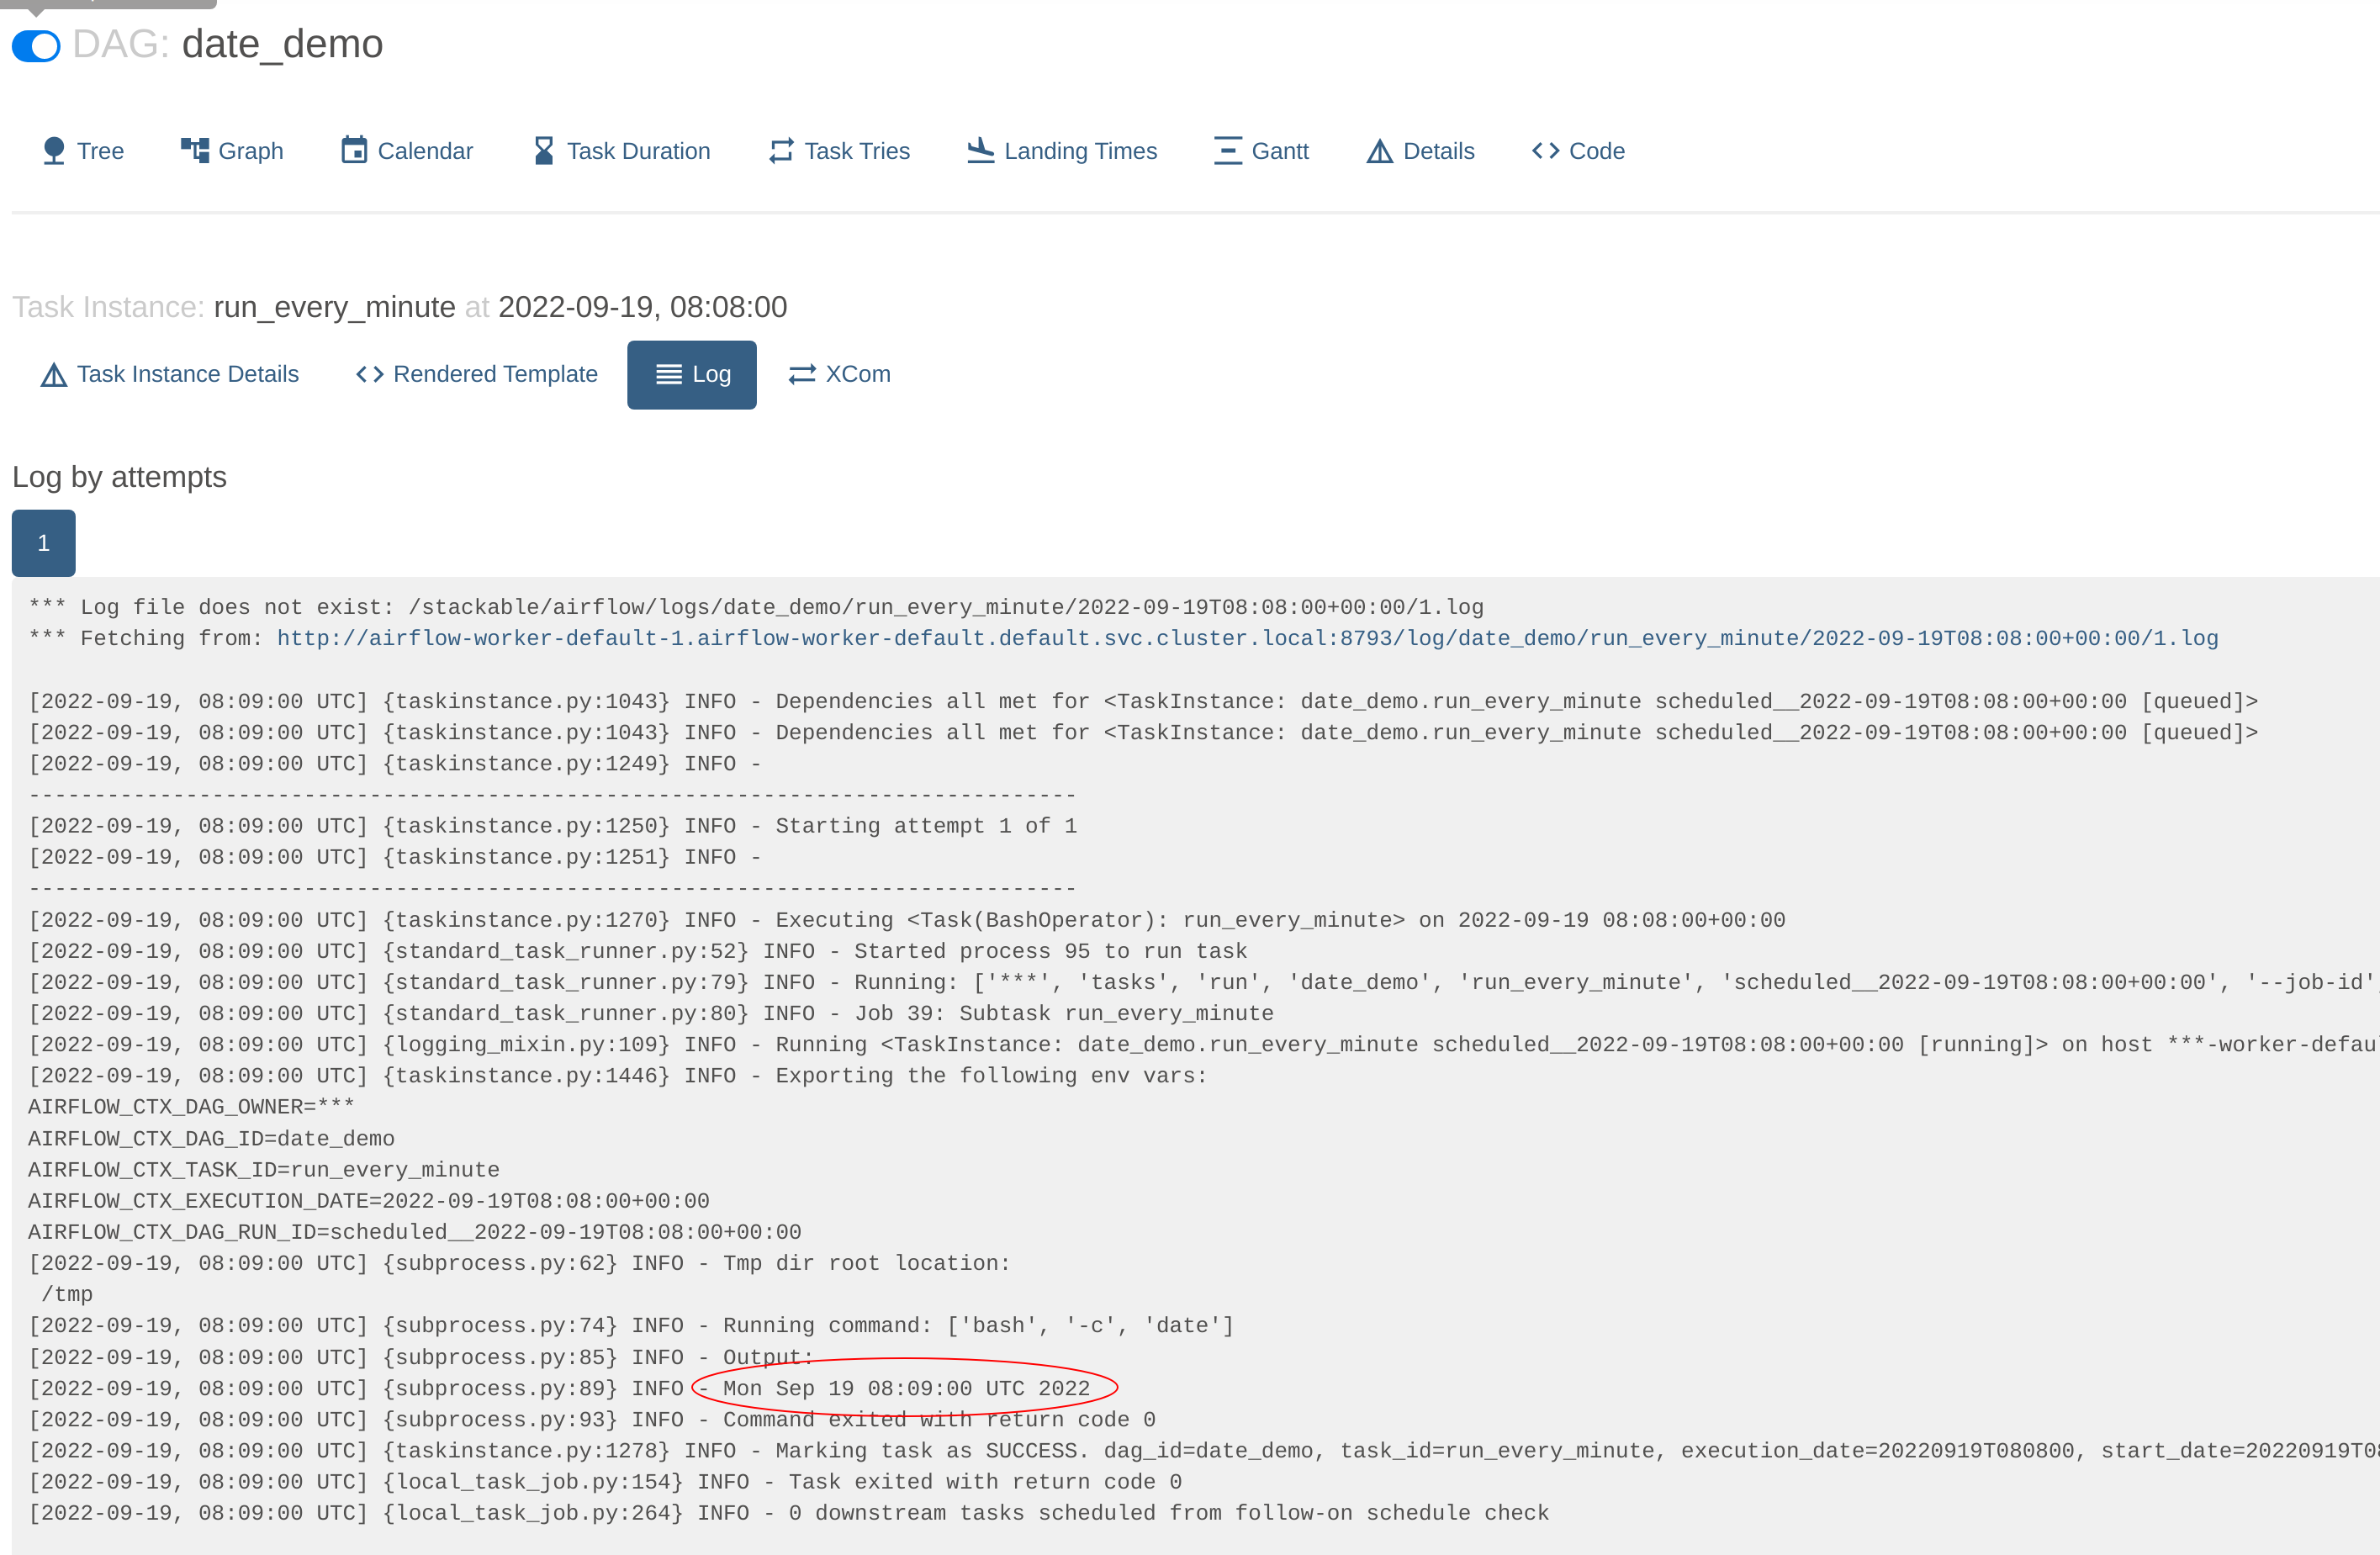
This will navigate to the worker where this job was run (with multiple workers the jobs will be queued and distributed to the next free worker) and display the log. In this case the output is a simple printout of the timestamp:
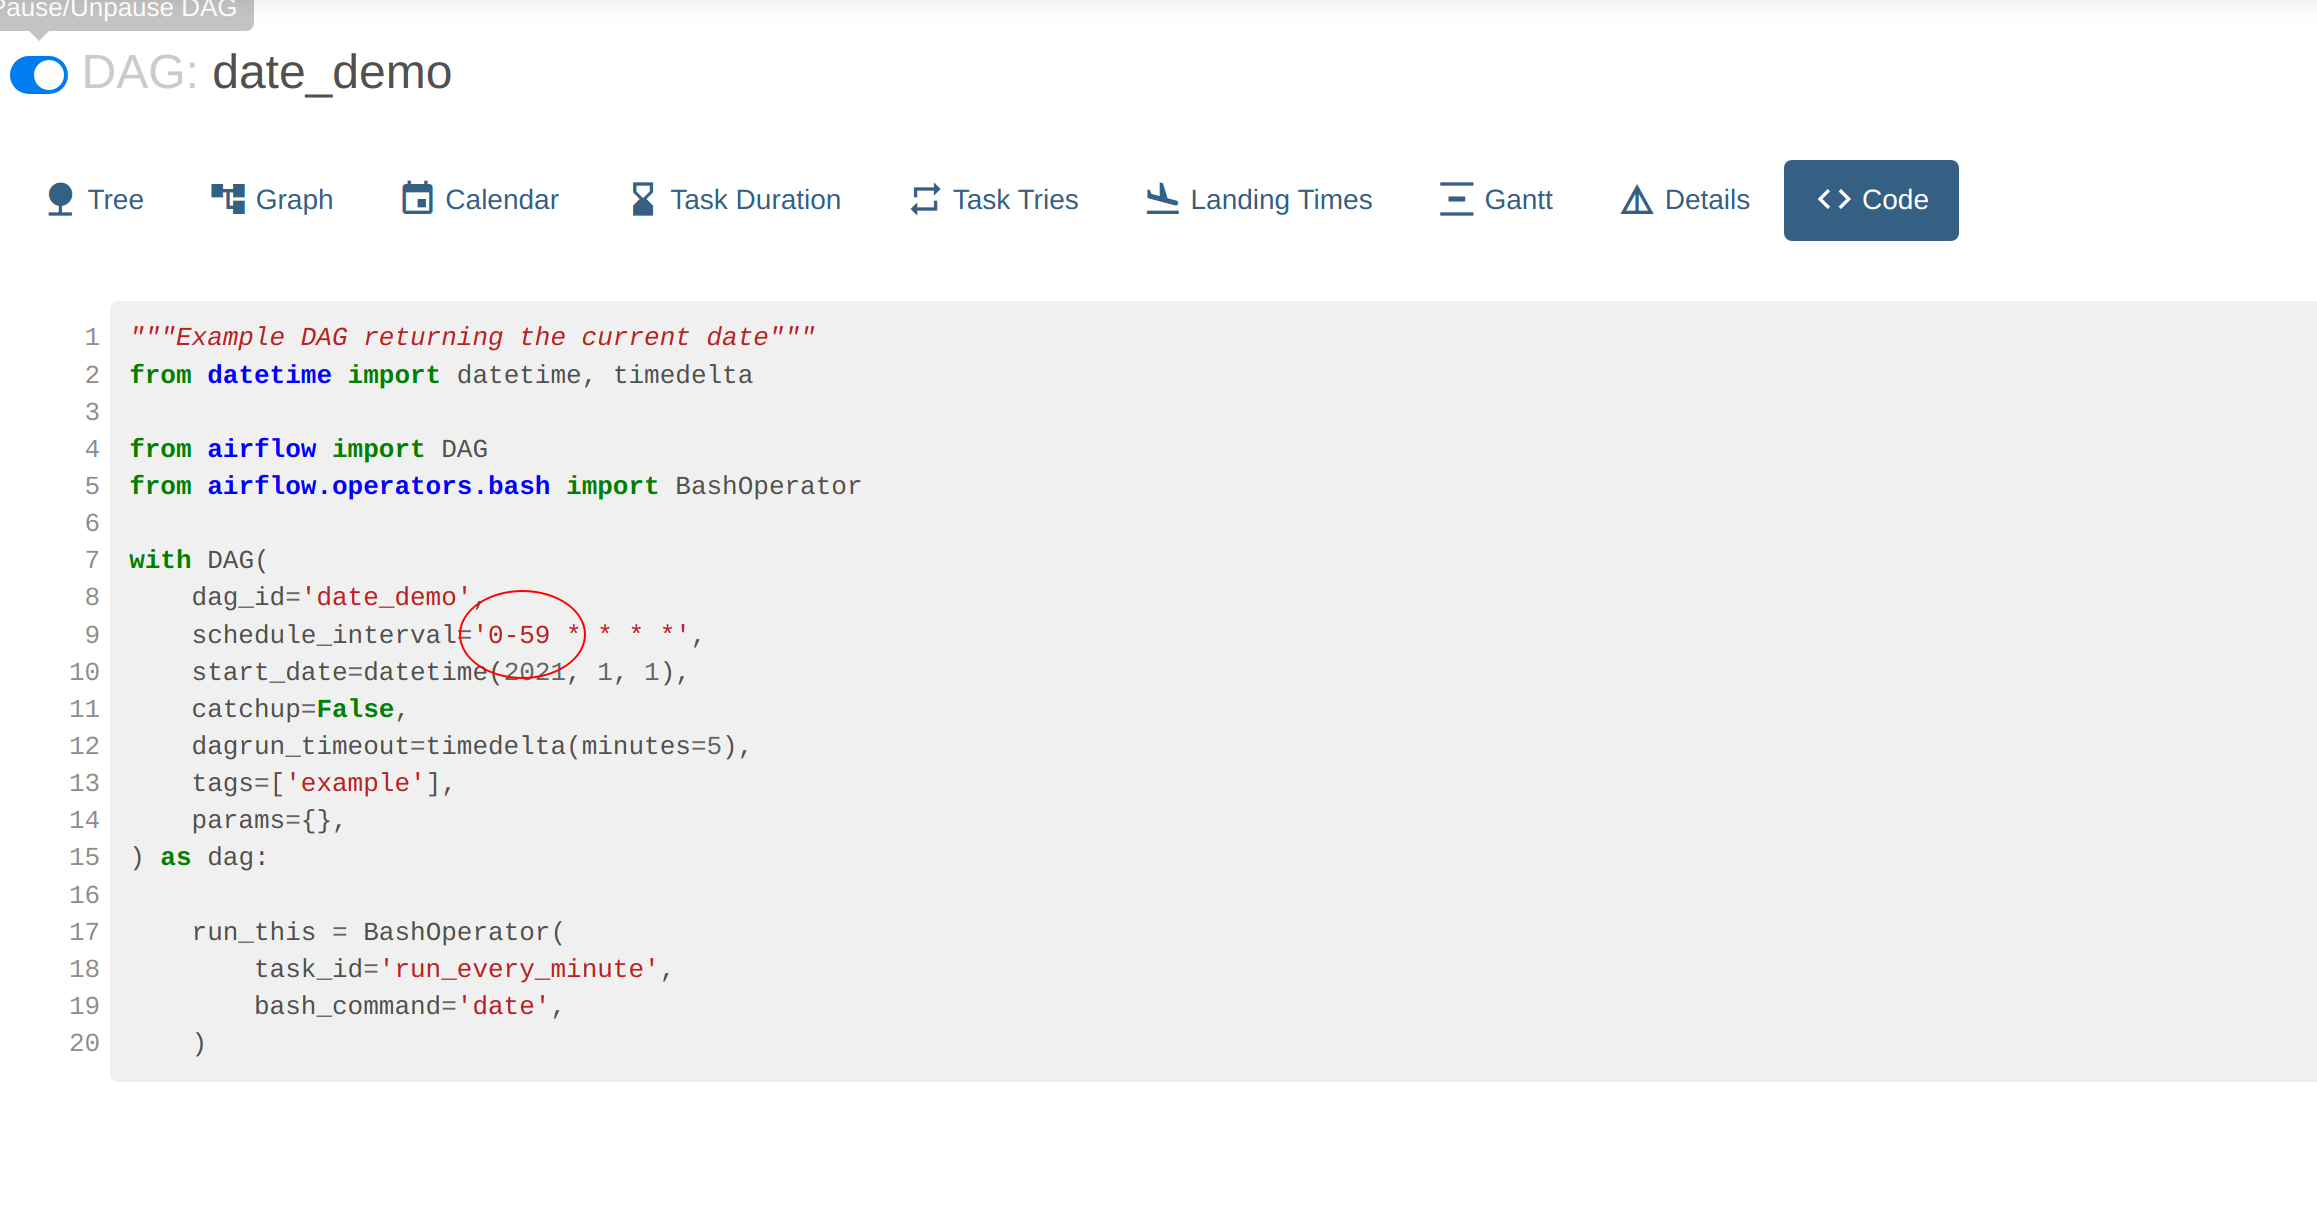
To look at the actual DAG code click on Code. Here we can see the crontab information used to schedule the job as well
the bash command that provides the output:
sparkapp_dag DAG
Go back to DAG overview screen. The sparkapp_dag job has a scheduled entry of None and a last-execution time
(2022-09-19, 07:36:55). This allows a DAG to be executed exactly once, with neither schedule-based runs nor any
backfill. The DAG can
always be triggered manually again via REST or from within the Webserver UI.

By navigating to the graphical overview of the job we can see that DAG has two steps, one to start the job - which runs asynchronously - and another to poll the running job to report on its status.

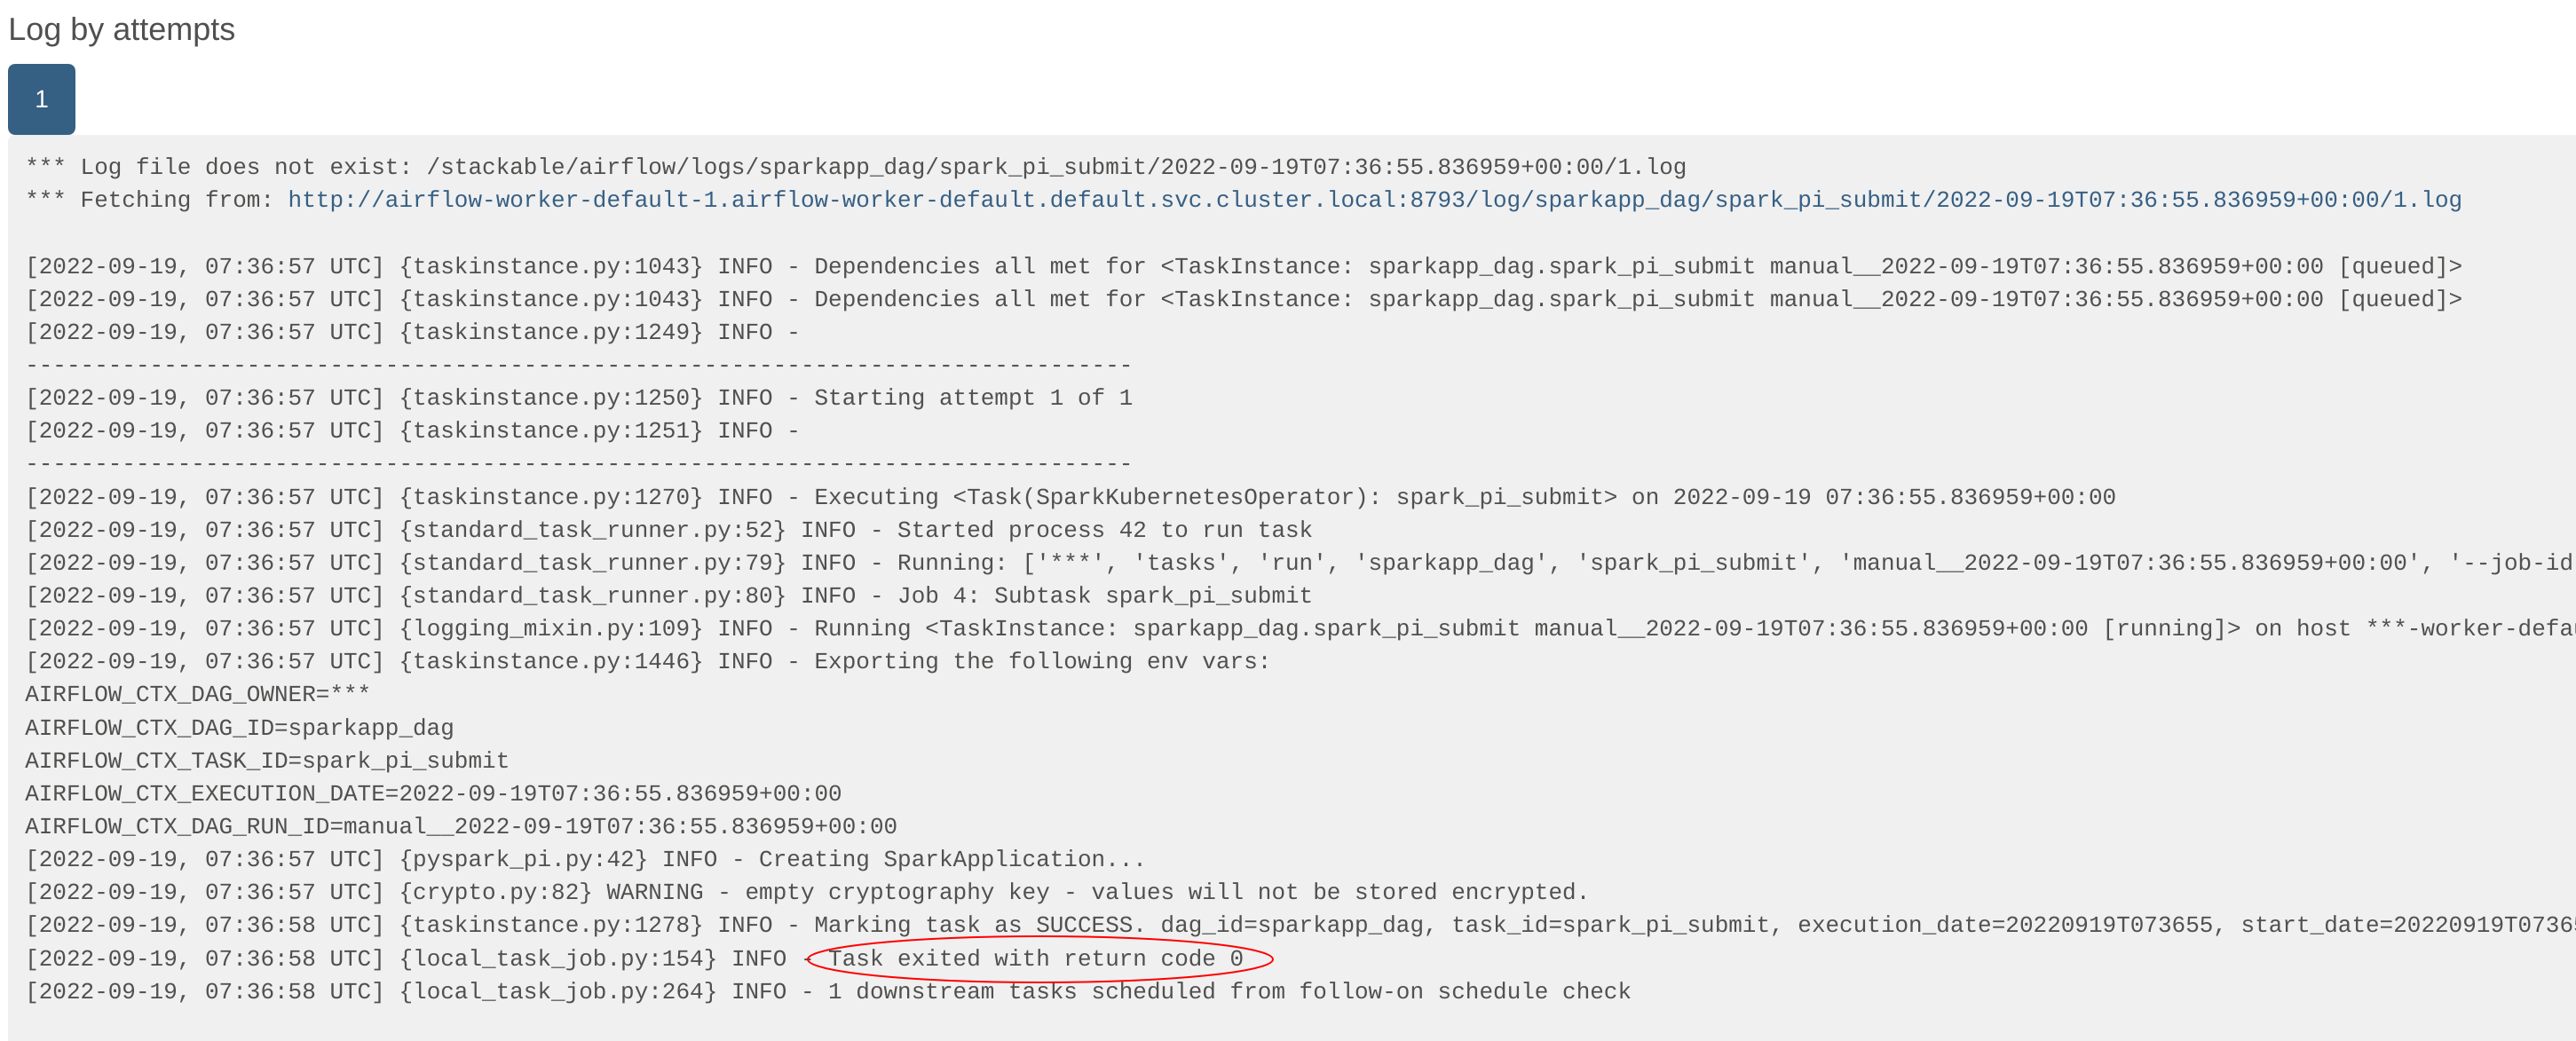
The logs for the first task - spark-pi-submit - indicate that it has been started, at which point the task exits
without any further information:
The second task - spark-pi-monitor - polls this job and waits for a final result (in this case: Success). In this
case, the actual result of the job (a value of pi) is logged by Spark in its driver pod, but more sophisticated jobs
would persist this in a sink (e.g. a Kafka topic or HBase row) or use the result to trigger subsequent actions.
